Friendly Workplace

Faculty and Staff Recruitment and Retention
The University’s workforce comprises 371 full-time faculty, 663 adjunct faculty, and 382 administrative staff as of October 15, 2025.
Under its Faculty Appointment and Promotion Regulations and Contract Personnel Employment Guidelines, recruitment is merit-based and free from discrimination. Indigenous employees and persons with disabilities each represent at least 1% of the workforce, as required by law. One employee grievance was filed in 2025, unrelated to human rights or equality.
Academic Year 2025 – Faculty and Staff Numbers
Academic Year 2025 Faculty and Staff Composition by Employment Category
Academic Year 2025 – Faculty and Staff Numbers
|
Gender |
Age Group |
Full-Time Faculty |
Part-Time Faculty |
Administrative Staff |
Administrative Staff (Contract) |
Subtotal |
Total |
|
Female
|
Age 30 or Below |
1 |
9 |
0 |
40 |
50 |
579 |
|
Ages 30–50 |
34 |
1101 |
70 |
63 |
268 | ||
|
Over Age 50 |
85 |
1129 |
39 |
8 |
261 |
||
|
Ratio % |
8.47% |
16.88% | 7.70% | 7.84% | 40.89% | ||
|
Male
|
Age 30 or Below |
1 |
9 |
0 |
22 |
32 |
82 |
|
Ages 30–50 |
63 |
169 |
58 |
46 |
336 |
||
|
Over Age 50 |
187 |
2246 |
26 |
10 |
469 |
||
|
Ratio % |
17.73% |
29.94% | 5.93% | 5.51% | 59.11% | ||
|
Total |
371 |
663 |
193 |
189 |
1,416 |
||
Note: Faculty and administrative staff figures are for the first semester of academic year 2025–26, as of October 15, 2025.
2025 Employment and Contract Types
|
Types |
Female |
Male |
Subtotal |
Total |
|
|
Employment Types |
Full-Time Employees |
340 |
413 |
753 |
1,416 |
|
Part-Time Employees |
239 |
424 |
663 |
||
|
Employment Contracts |
Permanent Employees |
229 |
335 |
564 |
1,416 |
|
Contract Employees |
350 |
502 |
852 |
||
|
Total |
1,158 |
1,674 |
2,832 |
1,158 |
|
|
Types |
Female |
Male |
Subtotal |
Total |
|
Student Assistants |
264 |
305 |
569 |
569 |
|
Other Diversity Indicators |
Female |
Ratio(%) |
Subtotal |
Ratio(%) |
|
Number of Employees with Disabilities |
9 |
1.55% |
7 |
0.84% |
|
Number of Indigenous Employees |
16 |
2.76% |
3 |
0.36% |
|
Other Worker Types |
Primary Duties |
Female |
Male |
Total |
|
Contractors |
Access control and campus security, campus cleaning, student cafeteria, on-campus convenience store, on-campus copy shop, on-campus bookstore, computer maintenance. |
50 |
63 |
113 |
|
Teaching Assistants |
Assisting in academic research, teaching, learning support, grant-based projects, and tutoring. |
259 |
295 |
554 |
Note: (1) Employee data are as of December 31, 2025. (2) the diversity ratio equals employees with disabilities divided by total employees in each category. (3) the number of non-employee workers remained stable compared with the previous year.
The University uses Ministry of Education funding to reward outstanding contributions in teaching, research, industry collaboration, and service, helping retain excellent faculty. Administrative duties and salaries are adjusted in response to staffing changes to strengthen employee retention.
Number of Departing and New Faculty and Staff by Age Group
|
Gender |
Number of Departing Employees |
Number of New Employees |
|||||||||||||
|
Female |
Male |
Female |
Male |
||||||||||||
|
Year |
Age |
<30 years old |
30-50 years old |
30-50 years old |
<30 years old |
30-50 years old |
30-50 years old |
<30 years old |
30-50 years old |
30-50 years old |
<30 years old |
30-50 years old |
30-50 years old |
||
|
2022 |
Headcount |
6 |
17 |
2 |
5 |
10 |
1 |
11 |
21 |
2 |
11 |
16 |
10 |
||
|
Total |
25 |
16 |
34 |
37 |
|||||||||||
|
2023 |
Headcount |
9 |
17 |
1 |
9 |
12 |
3 |
16 |
21 |
5 |
15 |
17 |
7 |
||
|
Total |
27 |
24 |
42 |
39 |
|||||||||||
|
2024 |
Headcount |
8 |
14 |
3 |
7 |
8 |
2 |
13 |
11 |
6 |
11 |
13 |
2 |
||
|
Total |
25 |
17 |
30 |
26 |
|||||||||||
| 2025 | Headcount | 13 | 23 | 3 | 6 | 12 | 2 | 23 | 24 | 5 | 11 | 18 | 1 | ||
| Total | 39 | 20 | 52 | 30 | |||||||||||
Note: Employee turnover and new hires were recorded from January 1 to December 31, 2025.
Faculty and Staff Development and Training
Each year, the University offers nearly 100 faculty development activities, including digital teaching, data security, and software training.
In 2025, it funded 186 faculty training and conference applications, 49 professional certification applications, and 66 administrative staff training applications.
Academic Year 2024 Faculty and Staff Participation in Training
|
Category / Gender |
Training Hours |
Number of Faculty/Staff |
Average Training Hours |
||
|
Full-time Faculty |
Female |
6,085 |
120 |
50.71 |
|
|
Male |
5,765 |
251 |
22.97 |
||
|
Full-time Administrative Staff |
Female |
537 |
459 |
1.17 |
|
|
Male |
353 |
586 |
0.6 |
||
|
|
|||||
Utilization of Subsidy Funds
|
Year |
Faculty Workshop Subsidies |
Faculty Certification Subsidies |
Staff Workshop Subsidies |
|||
|
Cases |
Amount (NTD) |
Cases |
Amount (NTD) |
Cases |
Amount (NTD) |
|
|
2023 |
143 |
1,086,123 |
56 |
642,469 |
12 |
59,584 |
|
2024 |
253 |
1,917,701 |
40 |
417,707 |
40 |
93,561 |
|
2025 |
186 |
1,556,439 |
49 |
334,040 |
66 |
213,698 |
Faculty and Staff Annual Evaluation and Promotion Mechanism
The University conducts annual staff evaluations under its Faculty Evaluation Regulations and Staff and Maintenance Worker Performance Appraisal Regulations. Faculty undergo annual evaluations and a comprehensive review every three years, while staff are assessed on performance, competence, and service.
In academic year 2024–25, 92.5% of eligible employees completed their evaluations. of these, 3.54% did not pass, mainly due to insufficient scores or excessive leave. All received follow-up counseling, with outcomes reported to the President.
Academic Year 2024 Faculty and Staff Evaluation
|
Category |
Number Evaluated |
Headcount |
Ratio |
||||
|
Female |
Male |
Female |
Male |
Female |
Male |
||
|
Full-time Faculty |
117 |
256 |
373 |
121 |
259 |
380 |
98.16% |
|
Administrative Staff |
109 |
87 |
196 |
111 |
88 |
199 |
98.49% |
|
Contract Staff |
80 |
66 |
146 |
112 |
82 |
194 |
75.26% |
|
Total |
306 |
409 |
715 |
344 |
429 |
773 |
92.50% |
The University reviews full-time faculty promotion applications each semester. From academic years 2022–23 to 2024–25, 37 faculty members were promoted: 18 to associate professor (48.65%), 13 to professor (35.13%), and 6 to assistant professor (16.22%). Publications remained the primary pathway, accounting for 19 promotions (51.35%).
Alternative pathways—including teaching practice research, technological innovation, and creative arts—have grown steadily. the University will continue providing guidance to advance faculty achievements in teaching, research, and industry collaboration.
From AY 2021 to AY 2023, Cheng Shiu University processed faculty promotion applications once per semester, with a total of 35 faculty members successfully promoted. The majority (17 individuals, 48%) advanced through scholarly publications. The university has increasingly encouraged diverse promotion pathways, such as teaching practice, technological R&D, and artistic creation/performance, with approvals via these routes growing annually. By rank, promotions to Professor accounted for 34.28% (12 individuals) and to Associate Professor 51.43% (18 individuals).
|
Teaching Practice-Based Faculty Promotion |
Faculty who integrate USR into courses, advance local engagement and talent development, or demonstrate innovative teaching methods and measurable improvements in student learning may apply for promotion through a teaching practice technical report. |
|
Industry Practice-Based Faculty Promotion |
Faculty who integrate USR into teaching may apply for promotion through scholarly works, technical reports, or creative works arising from research and industry collaboration. |
Faculty and Staff Compensation, Benefits, and Parental Leave Applications
The University maintains a fair compensation system under its Employee Compensation Regulations, with annual salary increments based on performance evaluations. Compensation is administered through institutional regulations and procedures rather than an independent remuneration committee.
Since January 2024, faculty salaries have aligned with public university standards. Holiday bonuses were discontinued, with resources redirected toward improving employee compensation and retention.
Faculty and Staff Benefits
•Marriage Grant
•Funeral Grant
•Education Grant
•Travel Grant
•Special Grant
•Teacher Appreciation Grant
•Group Insurance
Under the Employee Welfare Guidelines, the University provides statutory insurance and pensions, health checks, employee trips, recreational activities, family-related subsidies, gifts, and wellness clubs to support employee well-being, work–life balance, and workplace engagement.
Employees may also take unpaid leave for childcare, family care, further education, or other statutory reasons, with the right to resume their positions and salaries upon return.
2025 Parental Leave Without Pay and Return-to-Work Status
|
Item |
Male |
Female |
Total |
|
Number of Parental Leave Without Pay Applications in 2024 |
1 |
9 |
10 |
|
Number of Employees Scheduled to Return from Parental Leave Without Pay in 2024(A) |
0 |
6 |
6 |
|
Number of Employees Scheduled to Return from Parental Leave Without Pay in 2024 Who Actually Returned(B) |
0 |
5 |
5 |
|
Number of Employees Returning from Parental Leave Without Pay in 2023(C) |
1 |
4 |
5 |
|
Number of Employees Returning from Parental Leave Without Pay in 2023 Who Remained Employed 12 Months After Return(D) |
1 |
4 |
5 |
|
Return-to-Work Rate (%)= B/A |
- |
83.33% |
83.33% |
|
Retention Rate (%)= D/C |
100% |
100% |
100% |
Promoting A Family-Friendly Campus
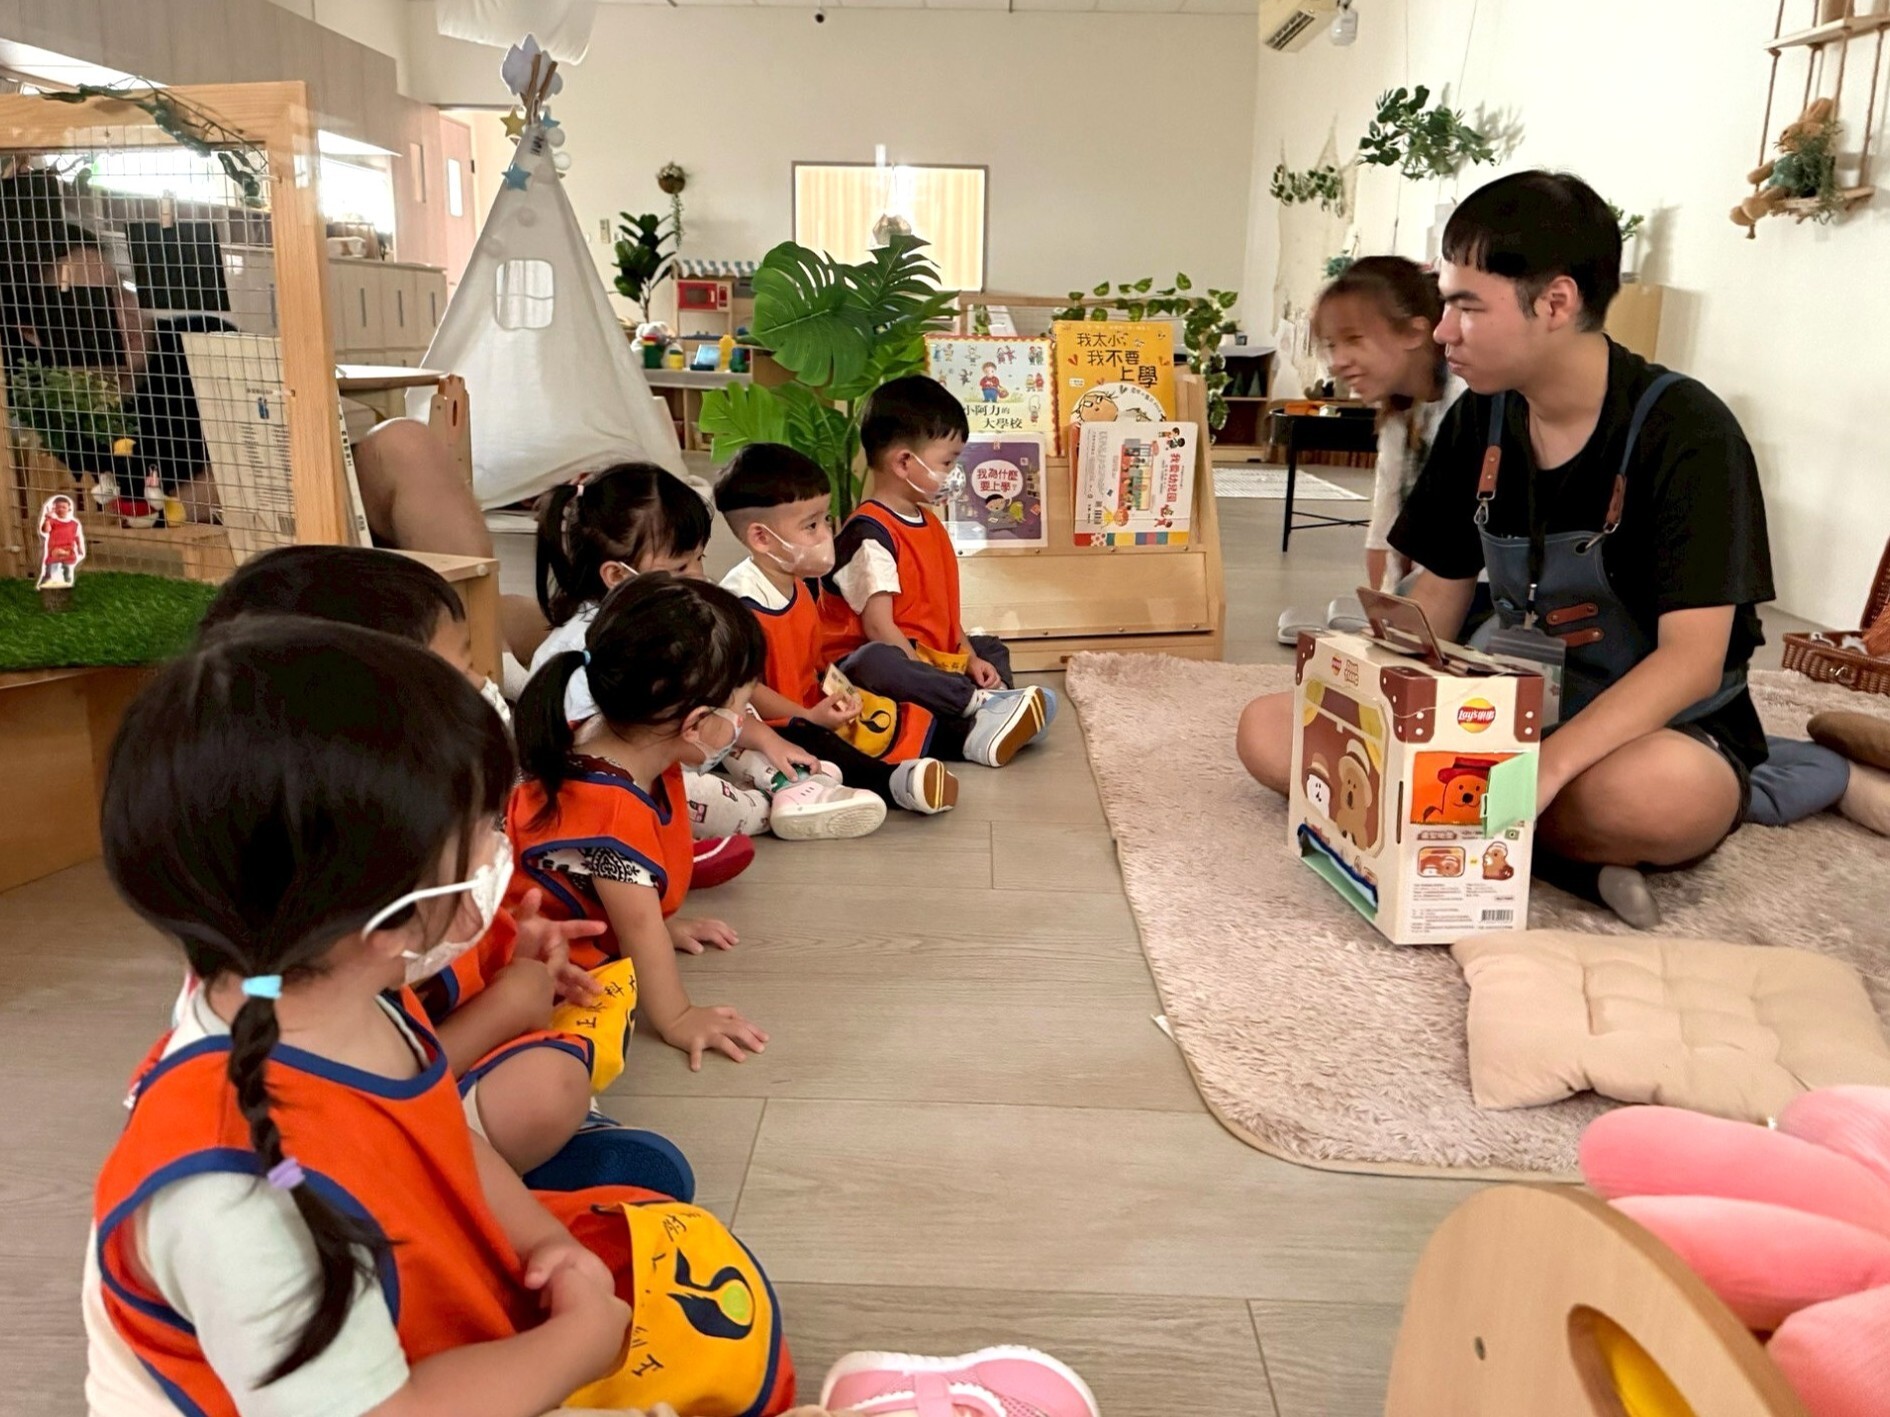
The University provides three private and well-equipped lactation rooms, recognized with an Excellence Award by Kaohsiung City. the CSU Affiliated Preschool offers quality childcare from 7:30 a.m. to 6:00 p.m., with enrollment and monthly fee subsidies for employees’ children, supporting work–family balance.

Occupational Safety and Health Committee Operations
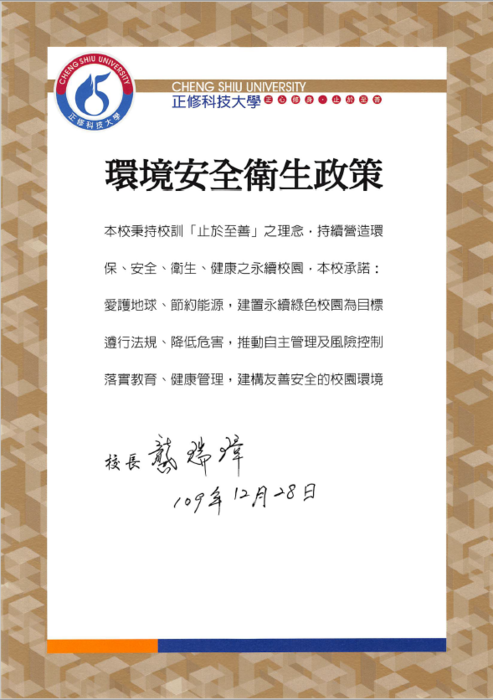
To prevent occupational hazards and protect campus safety and health, the University implements its Environmental Safety and Health Policy, Occupational Safety and Health Management Regulations, and Occupational Safety and Health Operating Standards.
The President chairs the Occupational Safety and Health Committee, while senior administrators oversee implementation across departments. the regulations cover all applicable campus workplaces and protect faculty, staff, students, contractors, and suppliers.
◎ Preventing Workplace Violence and Harassment
Cheng Shiu University maintains policies and procedures to prevent workplace violence, threats, bullying, and harassment. Regular risk assessments and surveys identify potential hazards. the University adopts zero tolerance and provides a dedicated grievance channel (envir@gcloud.csu.edu.tw) to protect employees, students, and campus safety.
Hazard Identification and Risk Assessment Measures
To effectively meet occupational safety and health management requirements, Cheng Shiu University has established the Hazard Identification and Risk Assessment Implementation Guidelines to address safety and health hazards faced by faculty, staff, and students in campus environments. Assessments are reviewed and updated annually in January. When new operational activities are introduced—such as new equipment, processes, or changes to work procedures—reassessment and updates are also required.
In 2024, hazard identification results recorded a total of 90 cases, comprising 87 low-risk, 3 medium-risk, and 1 minor-risk cases.meet safety and health management requirements, and to address the safety and health hazards and risks faced by faculty, staff, and students in the campus environment, Cheng Shiu University has established the "Hazard Identification and Risk Assessment Implementation Measures." These measures are reassessed and updated annually each January. If new operations are introduced on campus, such as new equipment, new processes, or changes in operating procedures, these must also be reassessed and updated. In 2023, the risk identification results included a total of 91 items, with 86 low-risk items and 5 medium-risk items.
|
Item |
2025 |
|
Moderate Risk |
7 |
|
Low Risk |
83 |
|
Minor Risk |
0 |
Hazard Identification, Risk Assessment, and Risk Control Planning Process and Risk Levels
|
Risk Level |
Risk Control Planning |
|
5-Critical Risk |
Immediate risk mitigation measures must be implemented. Operations should not begin or continue until the risk is reduced. |
|
4-High Risk |
Risk control measures must be implemented within a specified timeframe. Operations should not start until risks are reduced. Significant resources may be required. If current operations present high risk, mitigation must be expedited. |
|
3-Medium Risk |
Efforts should be made to reduce risks, such as: .Gradually implementing mitigation measures based on cost or financial considerations to lower the proportion of medium risks. .For medium risks with major or critical severity, further assess the likelihood of occurrence and use the results as a basis for improving control measures. |
|
2-Low Risk |
No immediate mitigation measures are required, but the effectiveness of existing safeguards must be ensured. |
|
1-Minor Risk |
No mitigation measures are required, but the effectiveness of existing safeguards must be ensured. |
Employees may leave work immediately upon identifying danger and report it to their supervisor without dismissal, reassignment, retaliation, wage loss, or other adverse action.
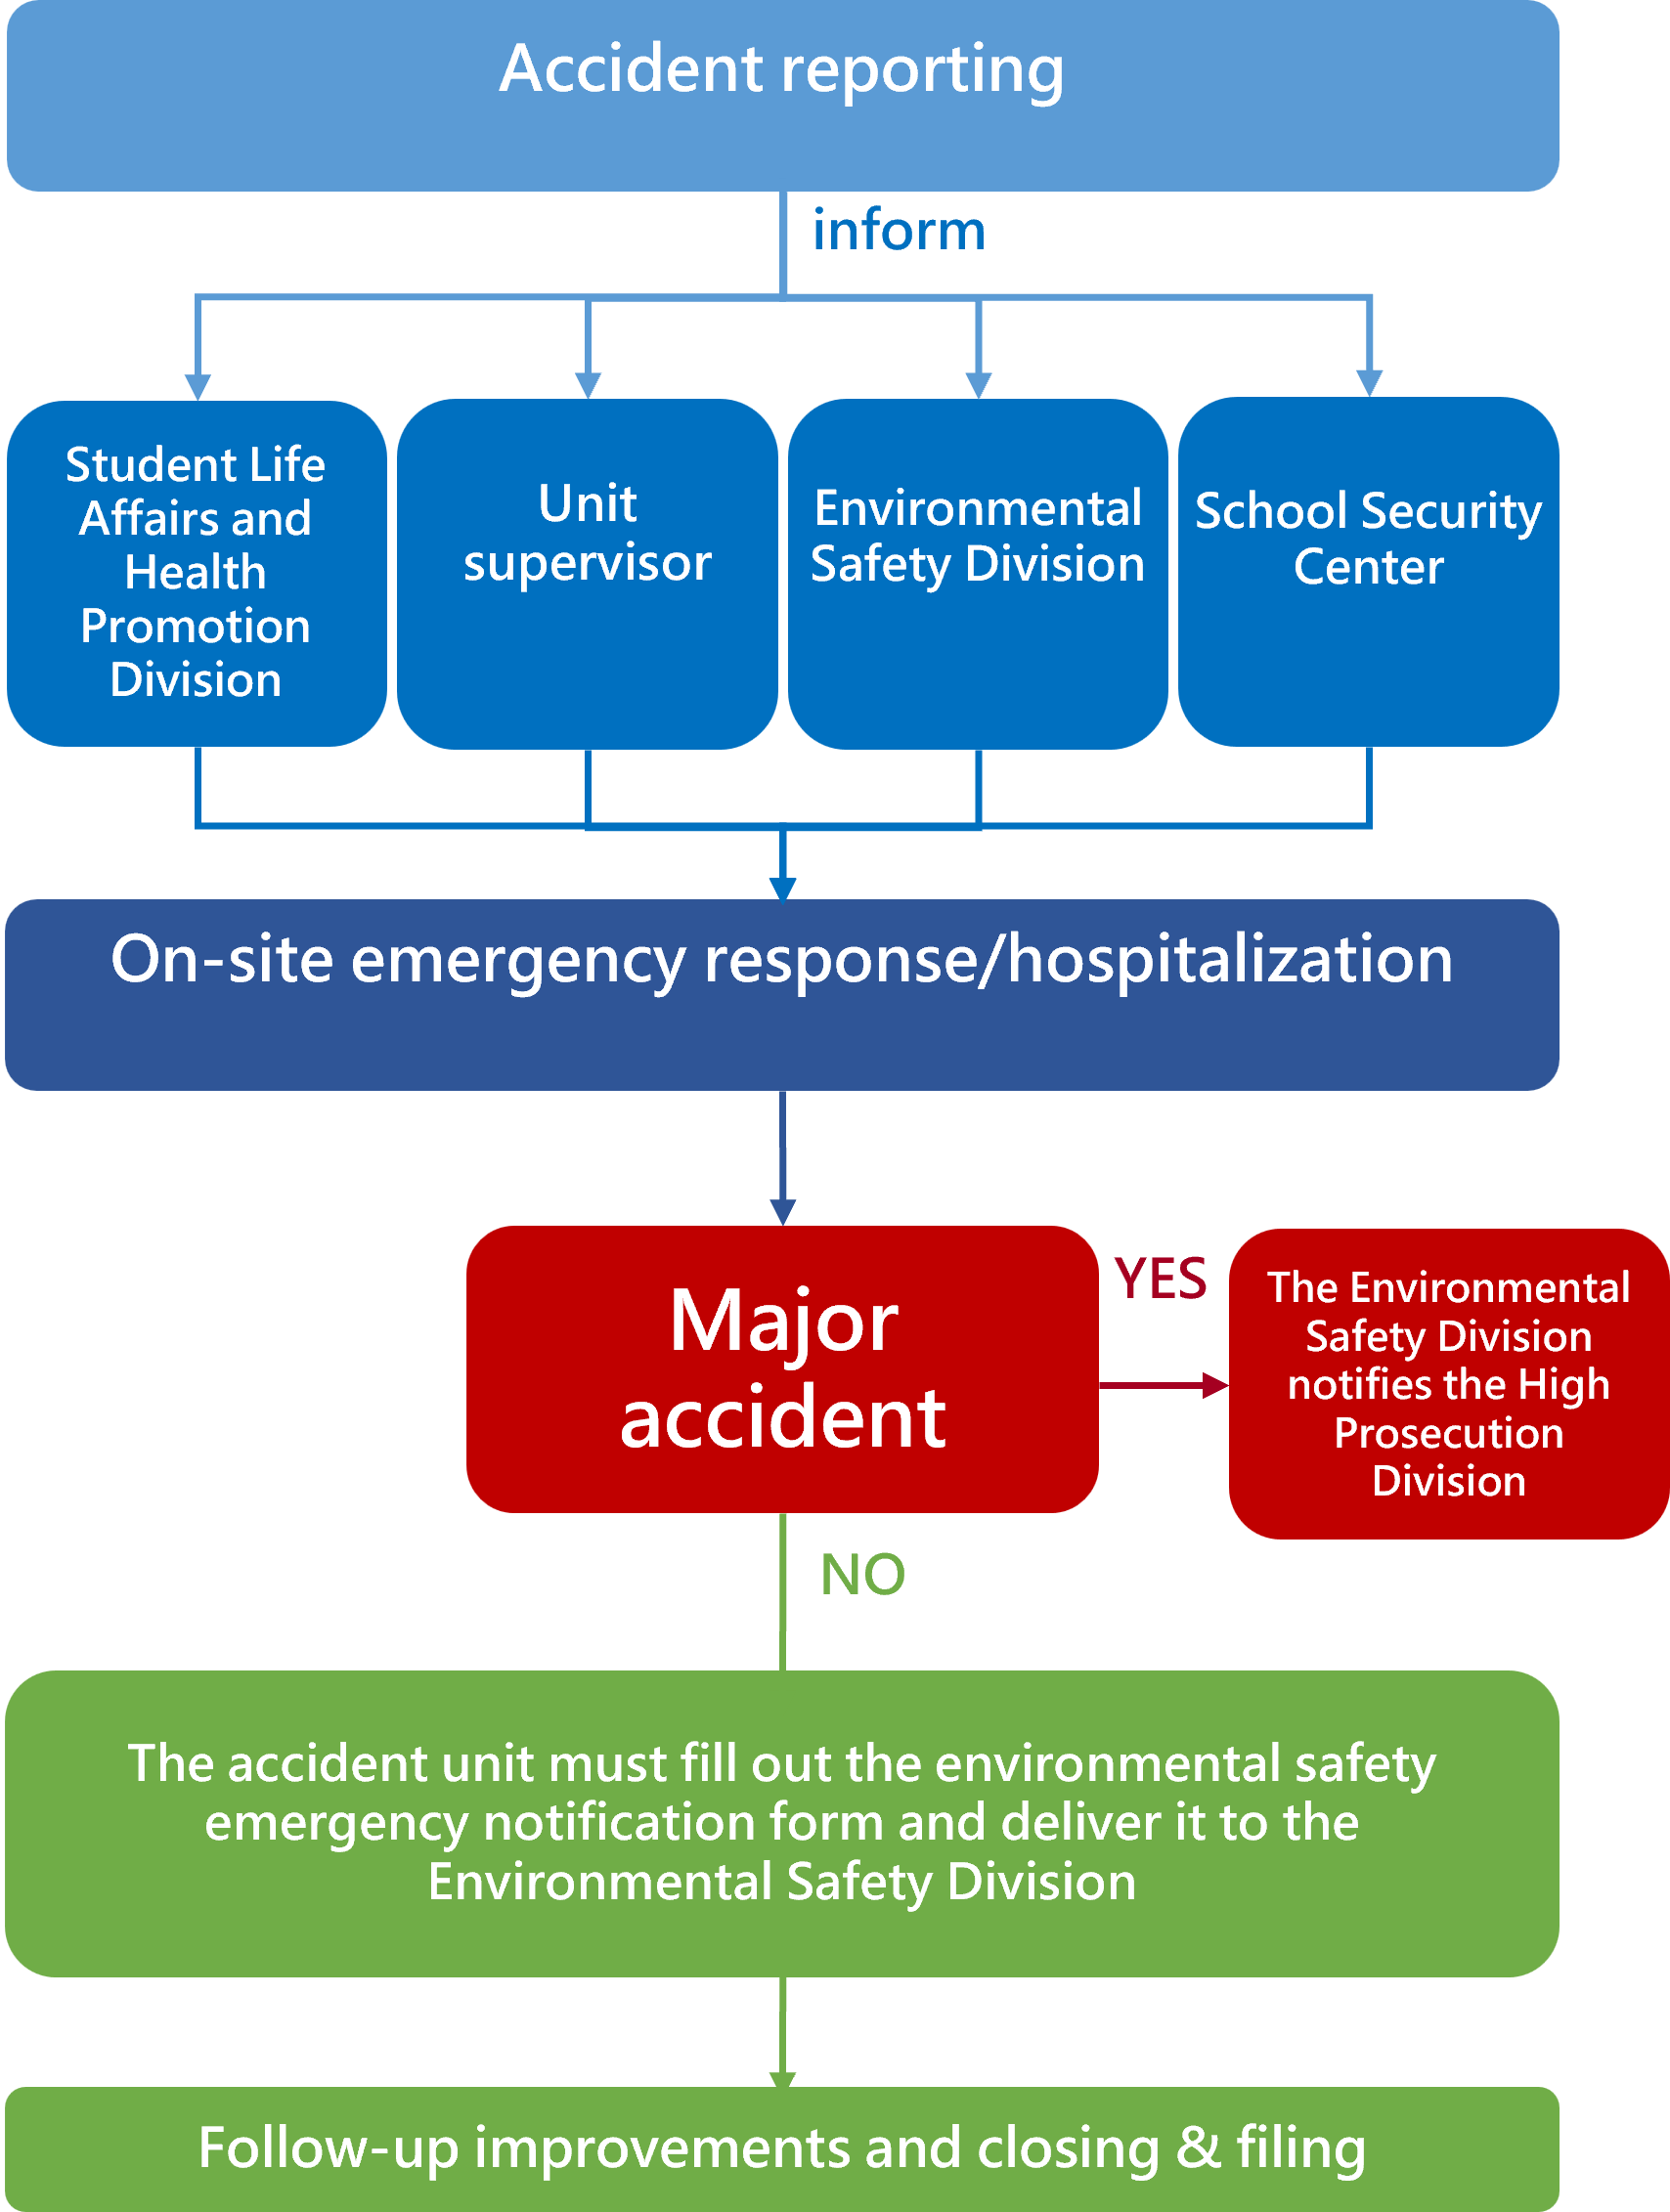
Occupational accidents and near misses involving University units or contractors must follow the Incident Reporting Procedure shown at right. Under the Occupational Safety and Health Management Regulations, annual safety training is provided. the Contractor Safety and Health Guidelines require pre-entry work applications, hazard notification, on-site inspections, and timely corrective action.
Occupational Safety and Health Management Training Programs in 2025
|
Course |
Total Course Hours |
Number of Participants |
|
Safety and Health Training for New Employees and Graduate Students |
504 |
168 |
|
Toxic and Concerned Chemical Substances Hazard Training |
60 |
20 |
|
Radiation Protection Training |
69 |
23 |
|
General In-Service Safety and Health Training |
1,653 |
551 |
|
Total |
2,286 |
762 |
◎ Occupational Injury Statistics for Faculty and Staff
In 2025, no occupational injuries or illnesses were reported among University employees or contractors.
|
Item |
Male |
Female |
Total |
|
Total Working Hours (hours) |
2,157,038 |
1,623,490 |
3,780,528 |
|
Total Number of Occupational Injuries |
0 |
0 |
0 |
|
Number of Serious Occupational Injuries (excluding fatalities) |
0 |
0 |
0 |
|
Number of Occupational Fatalities |
0 |
0 |
0 |
|
Recordable Occupational Injury Rate (%) |
0 |
0 |
0 |
|
Serious Occupational Injury Rate (%) |
0 |
0 |
0 |
Note: (1) occupational injury statistics exclude commuting accidents. (2) recordable occupational injury rate = (total occupational injuries ÷ total hours worked) × 1,000,000.
Faculty and Staff Health Promotion
Supported by the Ministry of Education’s Healthy Campus Program, the University promotes employee well-being through health management, education, and physical activities.
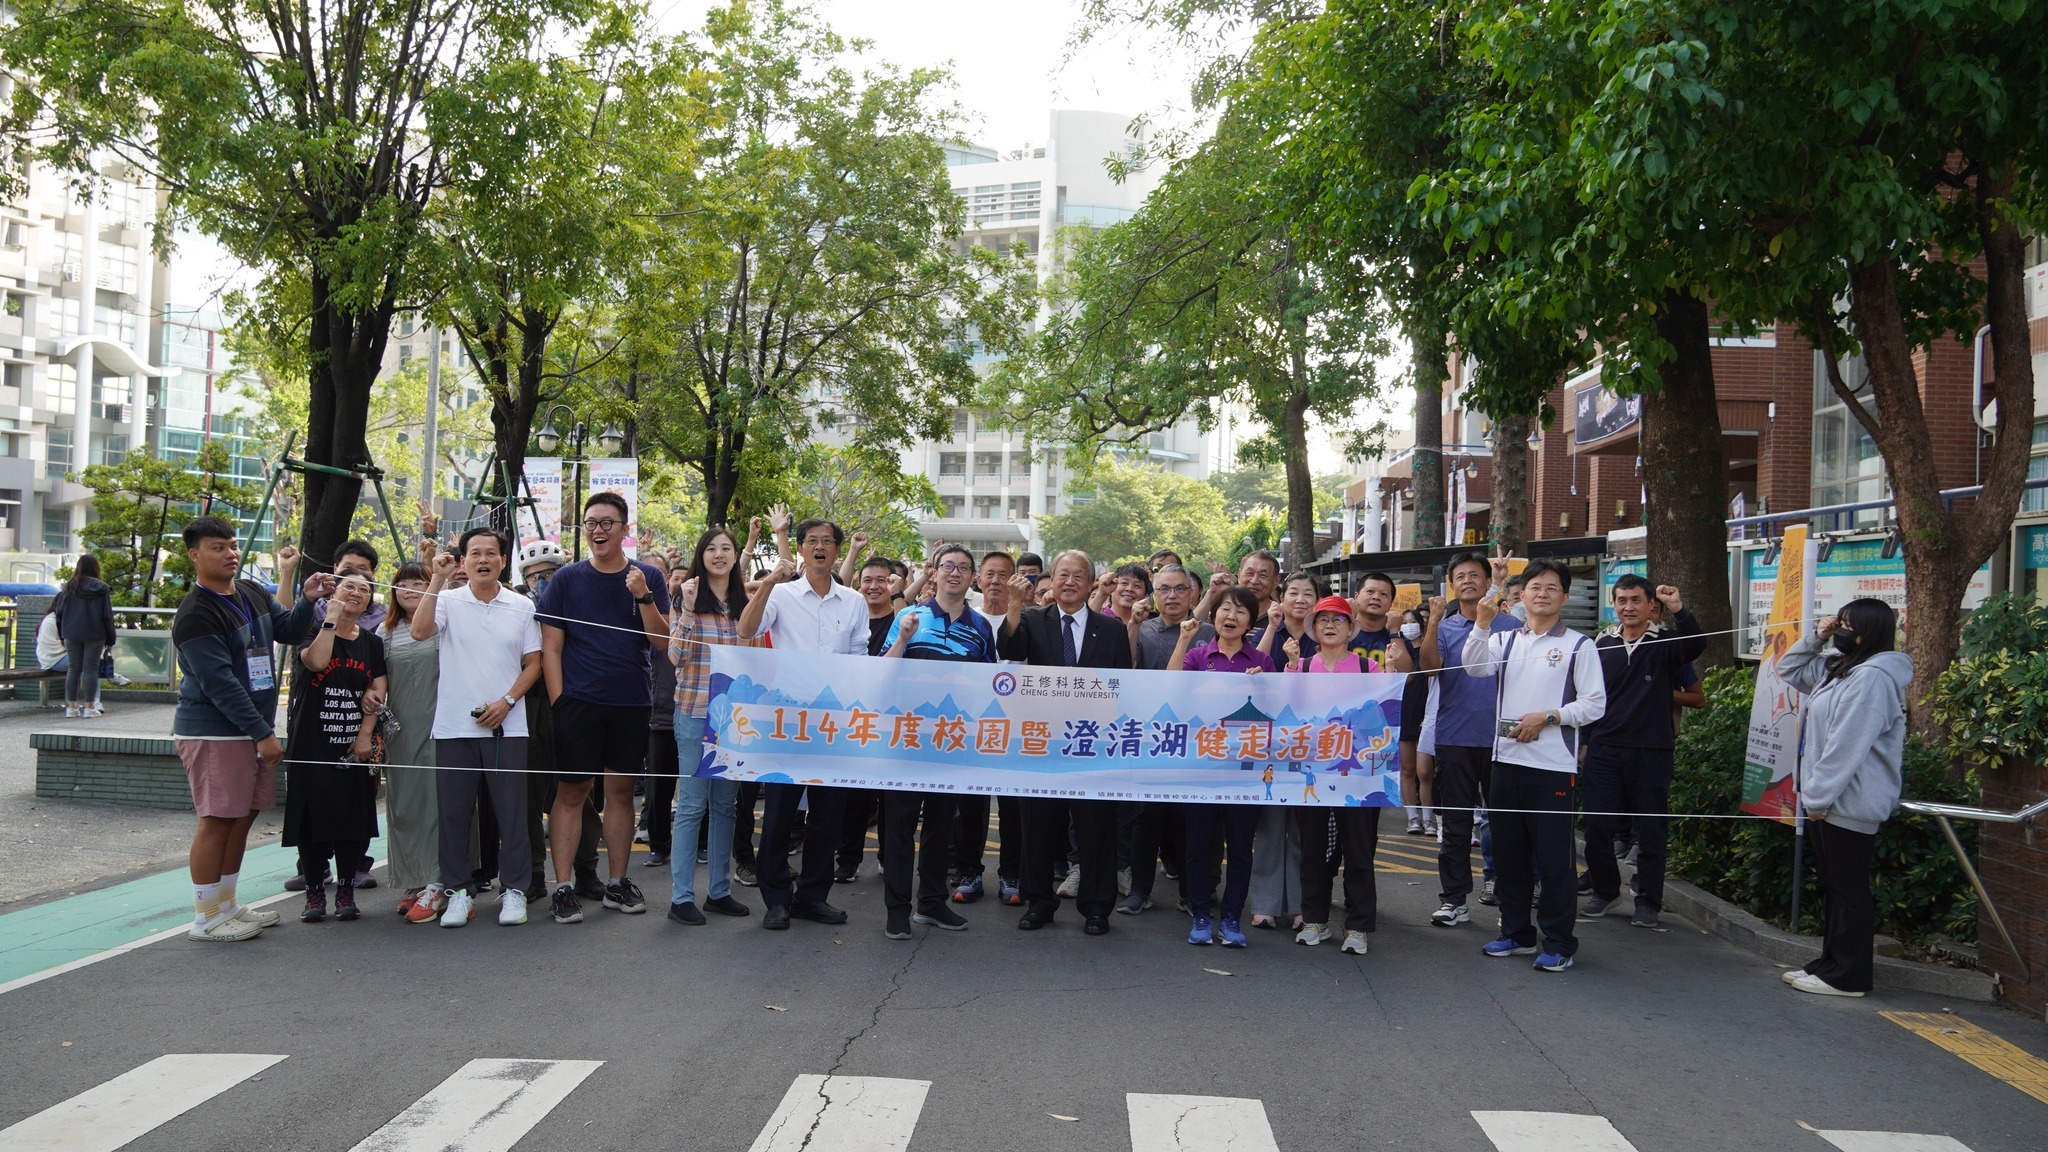
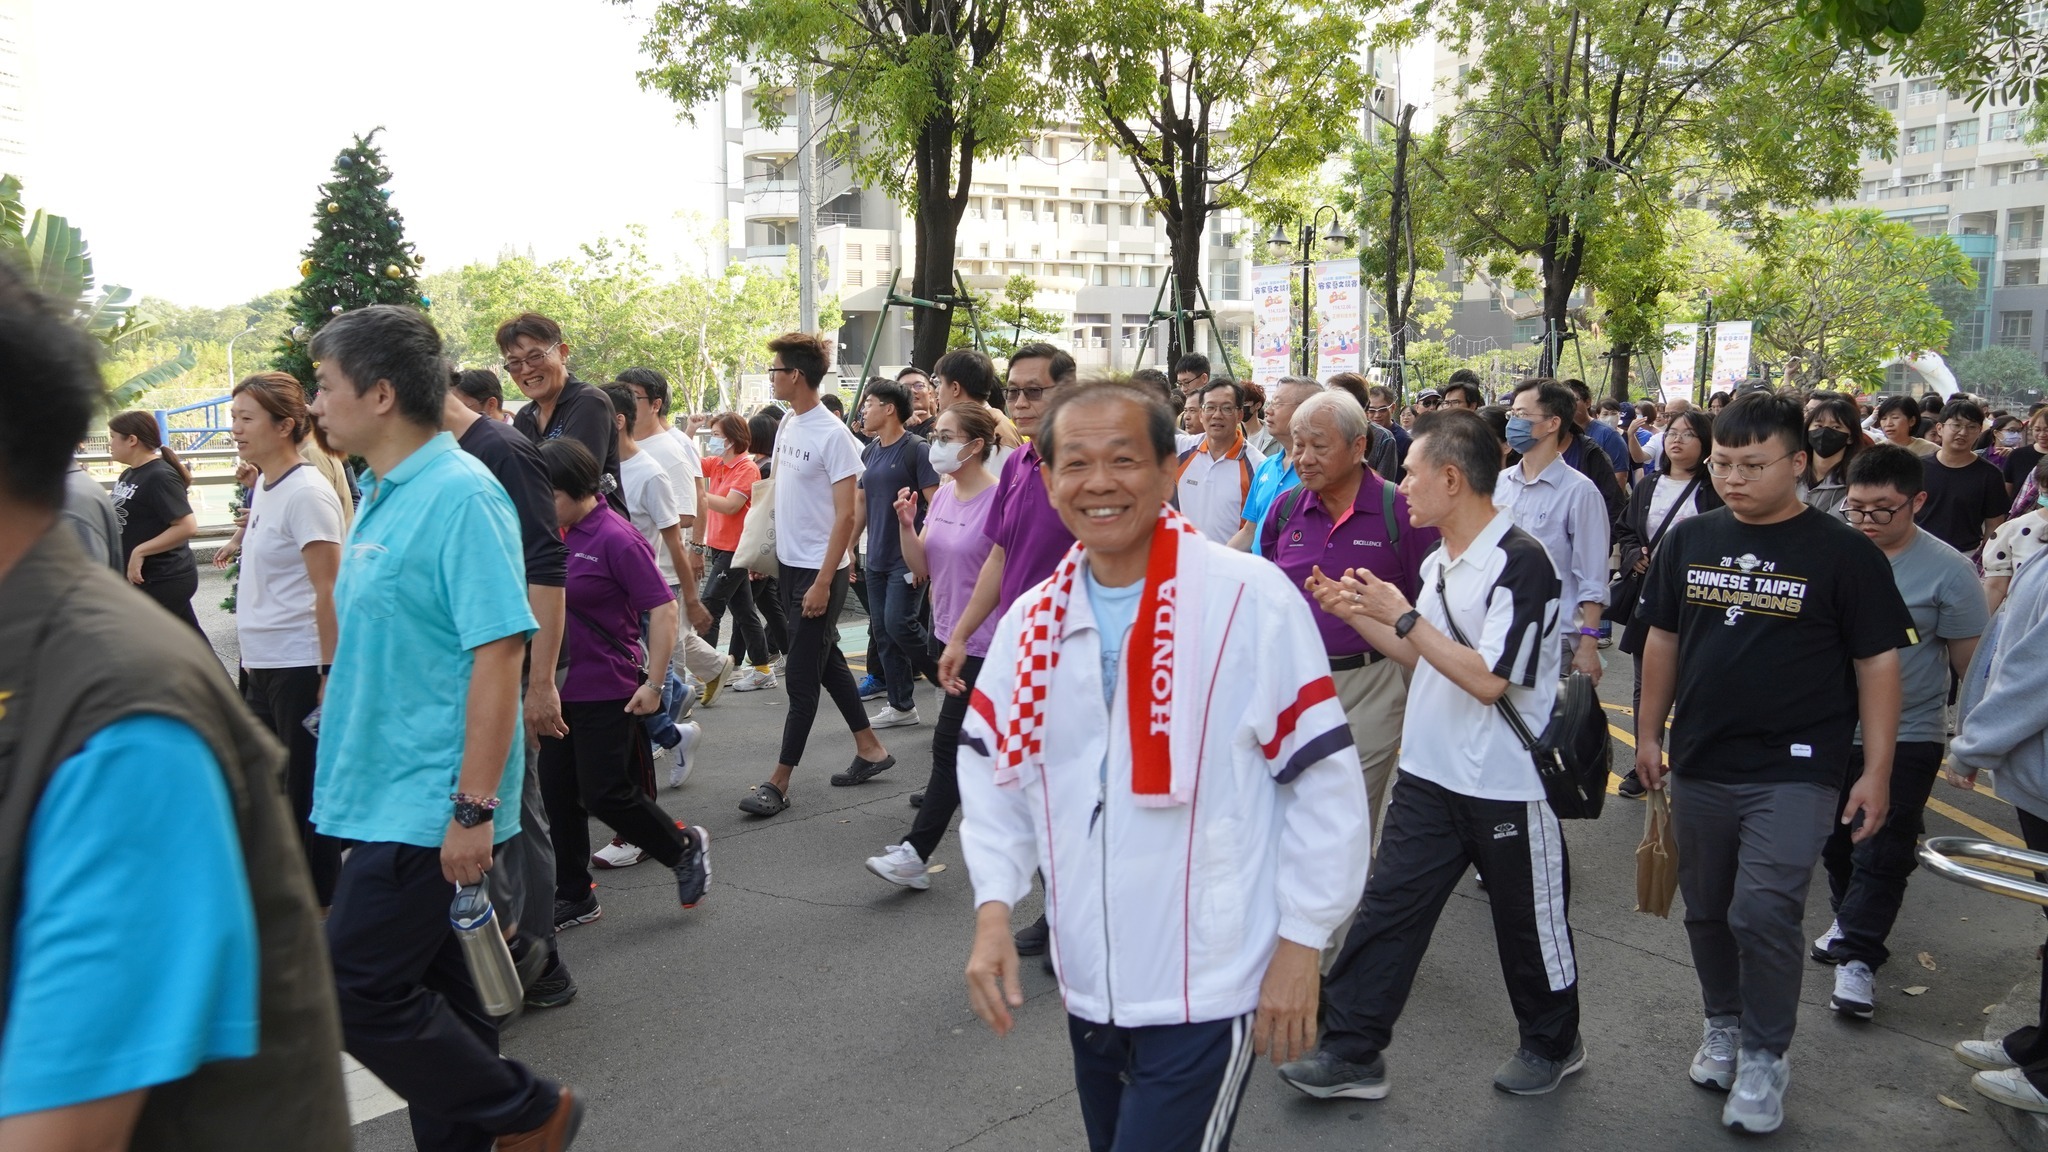
▲Niaosong Wetland Walk
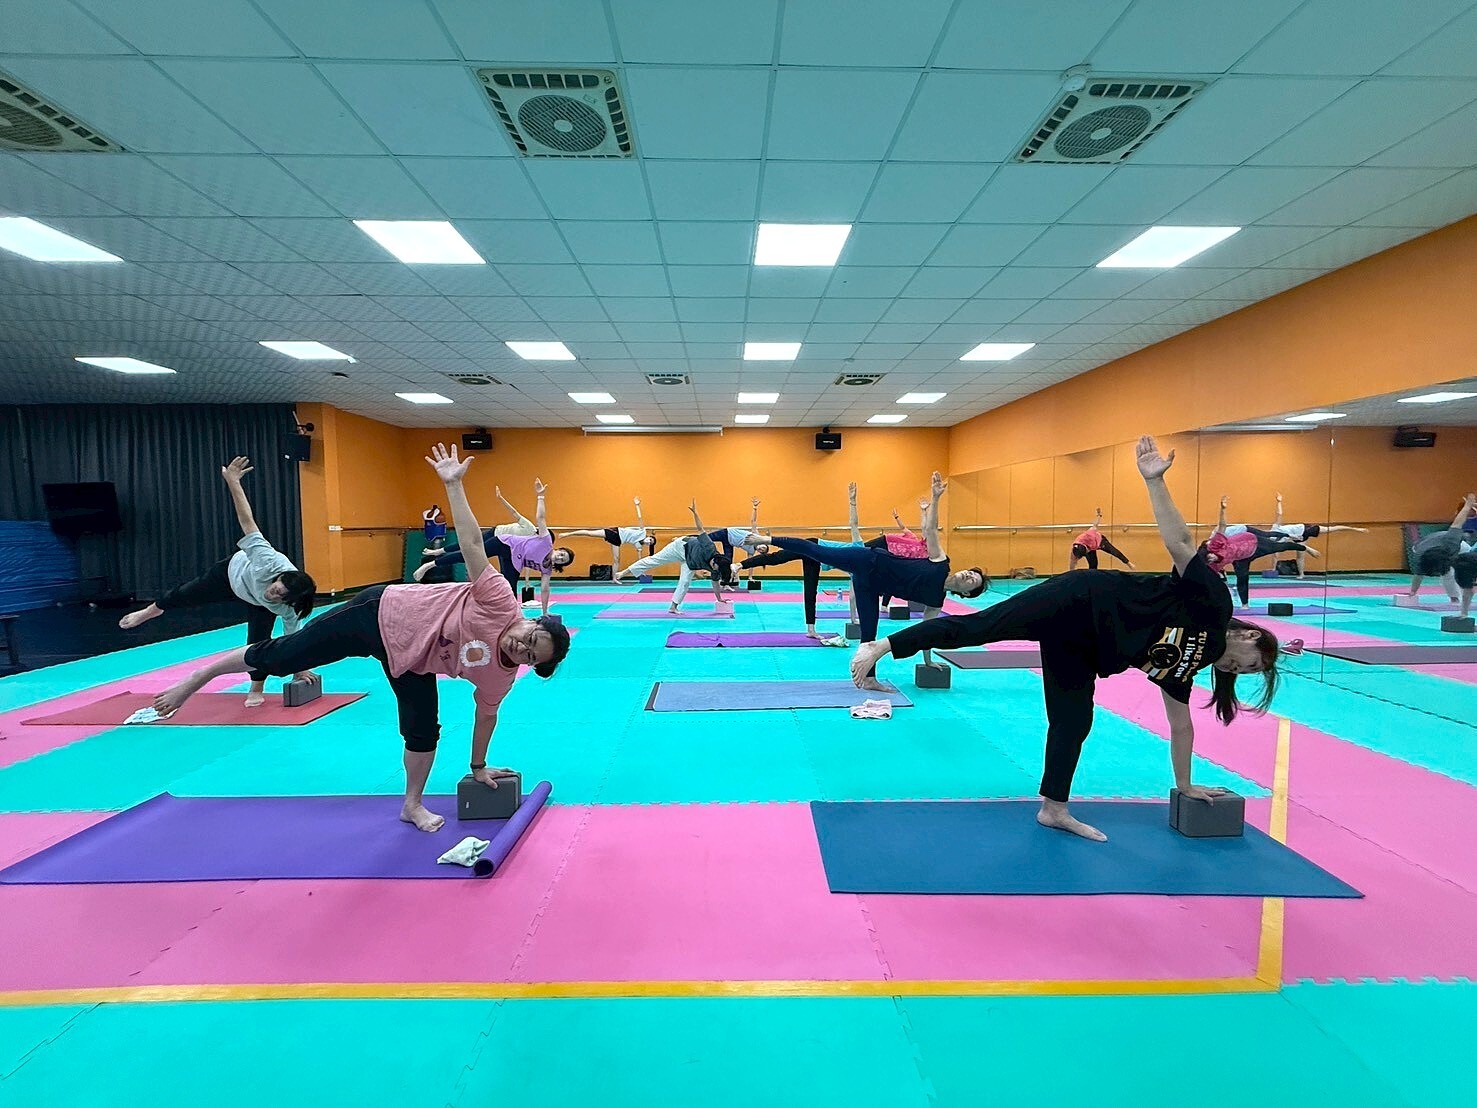
▲Employee Fitness Club – Multifunctional Training Class

▲ TSG Hawks Baseball Family Day