Energy Resource Management
Energy Resource Management
The Office of General Affairs serves as the core unit driving the University’s low-carbon campus initiative, committed to creating energy-efficient, resource-saving, healthy, and eco-friendly campus environments. To strengthen energy-saving outcomes, the University actively applies for government-funded energy improvement programs, investing NT$16 million between 2023 and 2024.
In alignment with national energy conservation policies, the University has established energy management guidelines, developed feasible energy-saving strategies, and set short-, medium-, and long-term targets. Key initiatives include prioritizing the procurement of energy-efficient products, enhancing energy use efficiency, and organizing environmental education campaigns. Using 2018 as the baseline year, the University has set an annual goal of reducing its Electricity Use Intensity (EUI) by 1%. To date, the cumulative reduction rate has reached 3.35%, underscoring the University’s ongoing commitment to energy conservation and carbon reduction.
Energy-Saving Targets (Short / Medium / Long Term)
|
Short Term |
● Replace the chiller system in the General Teaching Building, install energy-labeled inverter air conditioners, and equip them with control devices. ● Introduce card-based metering systems to reduce energy consumption. ● Conduct monthly cleaning of air conditioner filters, reducing electricity consumption by up to 10%. |
|
Medium |
● Replace chillers in the General Teaching Building and the Creative Living Building with inverter-type split air conditioners and card-based power control systems. ● Upgrade selected elevators in the General Teaching Building, with an expected annual reduction of 15,000 tCO2e. ● Gradually replace central air-conditioning units across campus and implement card-based power control for all air conditioners. ● Replace the chiller system in the Creative Living Building, install energy-labeled inverter air conditioners, and equip them with control devices. |
Energy-Saving Measures and Performance
In 2024, the University’s total energy consumption reached 57,480.058 GJ, with purchased electricity amounting to 14,583.642 MWh, representing a slight increase of 0.68% compared to 2023. However, this figure is not directly comparable, as the increase was primarily due to the commissioning of the Precision Machinery Training Factory and the completion and occupancy of the International Student Dormitory, which drove higher electricity demand.
Energy-Saving Measures Implemented in 2024
|
● Reduce power waste by providing air conditioning and electricity in general and specialized classrooms only during scheduled class hours. |
|
● Implement an energy management system in both campus buildings and dormitories, applying automated time-control mechanisms to switch electrical equipment on and off for more effective energy use. |
|
● Replace two outdated dormitory elevators and install regenerative power devices to recycle energy, reducing elevator electricity consumption. |
|
Item |
Unit |
2022 |
2023 |
2024 |
|
Purchased Electricity (Campus and Dormitories) |
(mWh) |
14,345.84 |
14,484.624 |
14,583.6420 |
|
GJ |
51,645.02 |
52,144.646 |
52,501.1112 |
|
|
Gasoline |
kL |
34.10622 |
27.2580 |
28.1684 |
|
GJ |
1,113.60 |
899.996 |
886.2815 |
|
|
Diesel |
kL |
73.1225 |
83.5533 |
87.6365 |
|
GJ |
2,571.16 |
2,937.937 |
3,164.0051 |
|
|
Natural Gas |
m3 |
25.664 |
20.7788 |
22.7683 |
|
GJ |
966.87 |
782.821 |
564.4307 |
|
|
Liquefied Petroleum Gas (LPG) |
L |
14,078.59 |
13,576.824 |
14.6111 |
|
GJ |
391.02 |
377.084 |
364.2295 |
|
|
Total Energy Consumption |
GJ |
56,687.67 |
57,142.484 |
57,480.0580 |
|
Floor Area |
m2 |
212,732 |
215,168 |
215,168 |
|
Electricity Use Intensity (EUI) / Energy Intensity |
kWh/m2 |
67.44 |
67.318 |
67.7779 |
Notes1: Purchased electricity conversion: 1 kWh = 0.0036 GJ. Heating values: Gasoline 7,520 kcal/L; Diesel 8,629 kcal/L; Natural Gas 5,925 kcal/m³; LPG 5,958 kcal/L. Data reference: Bureau of Energy, Ministry of Economic Affairs – Unit Heating Values of Energy Products. Conversion: 1 kcal = 0.000004184 GJ.
Notes 2: Energy Intensity = Annual total electricity consumption ÷ Total floor area (kWh/m²·year). Floor area refers to the total floor space recorded on building permits. Calculation method: Purchased electricity consumption ÷ Floor area.
Notes 3: Cumulative Power-Saving Rate = (Baseline year consumption – Current year consumption) ÷ Baseline year consumption × 100%. Baseline year: 2018. Energy Usage Intensity (EUI) = Annual total electricity consumption ÷ Total floor area (unit: kWh/m²·year).
|
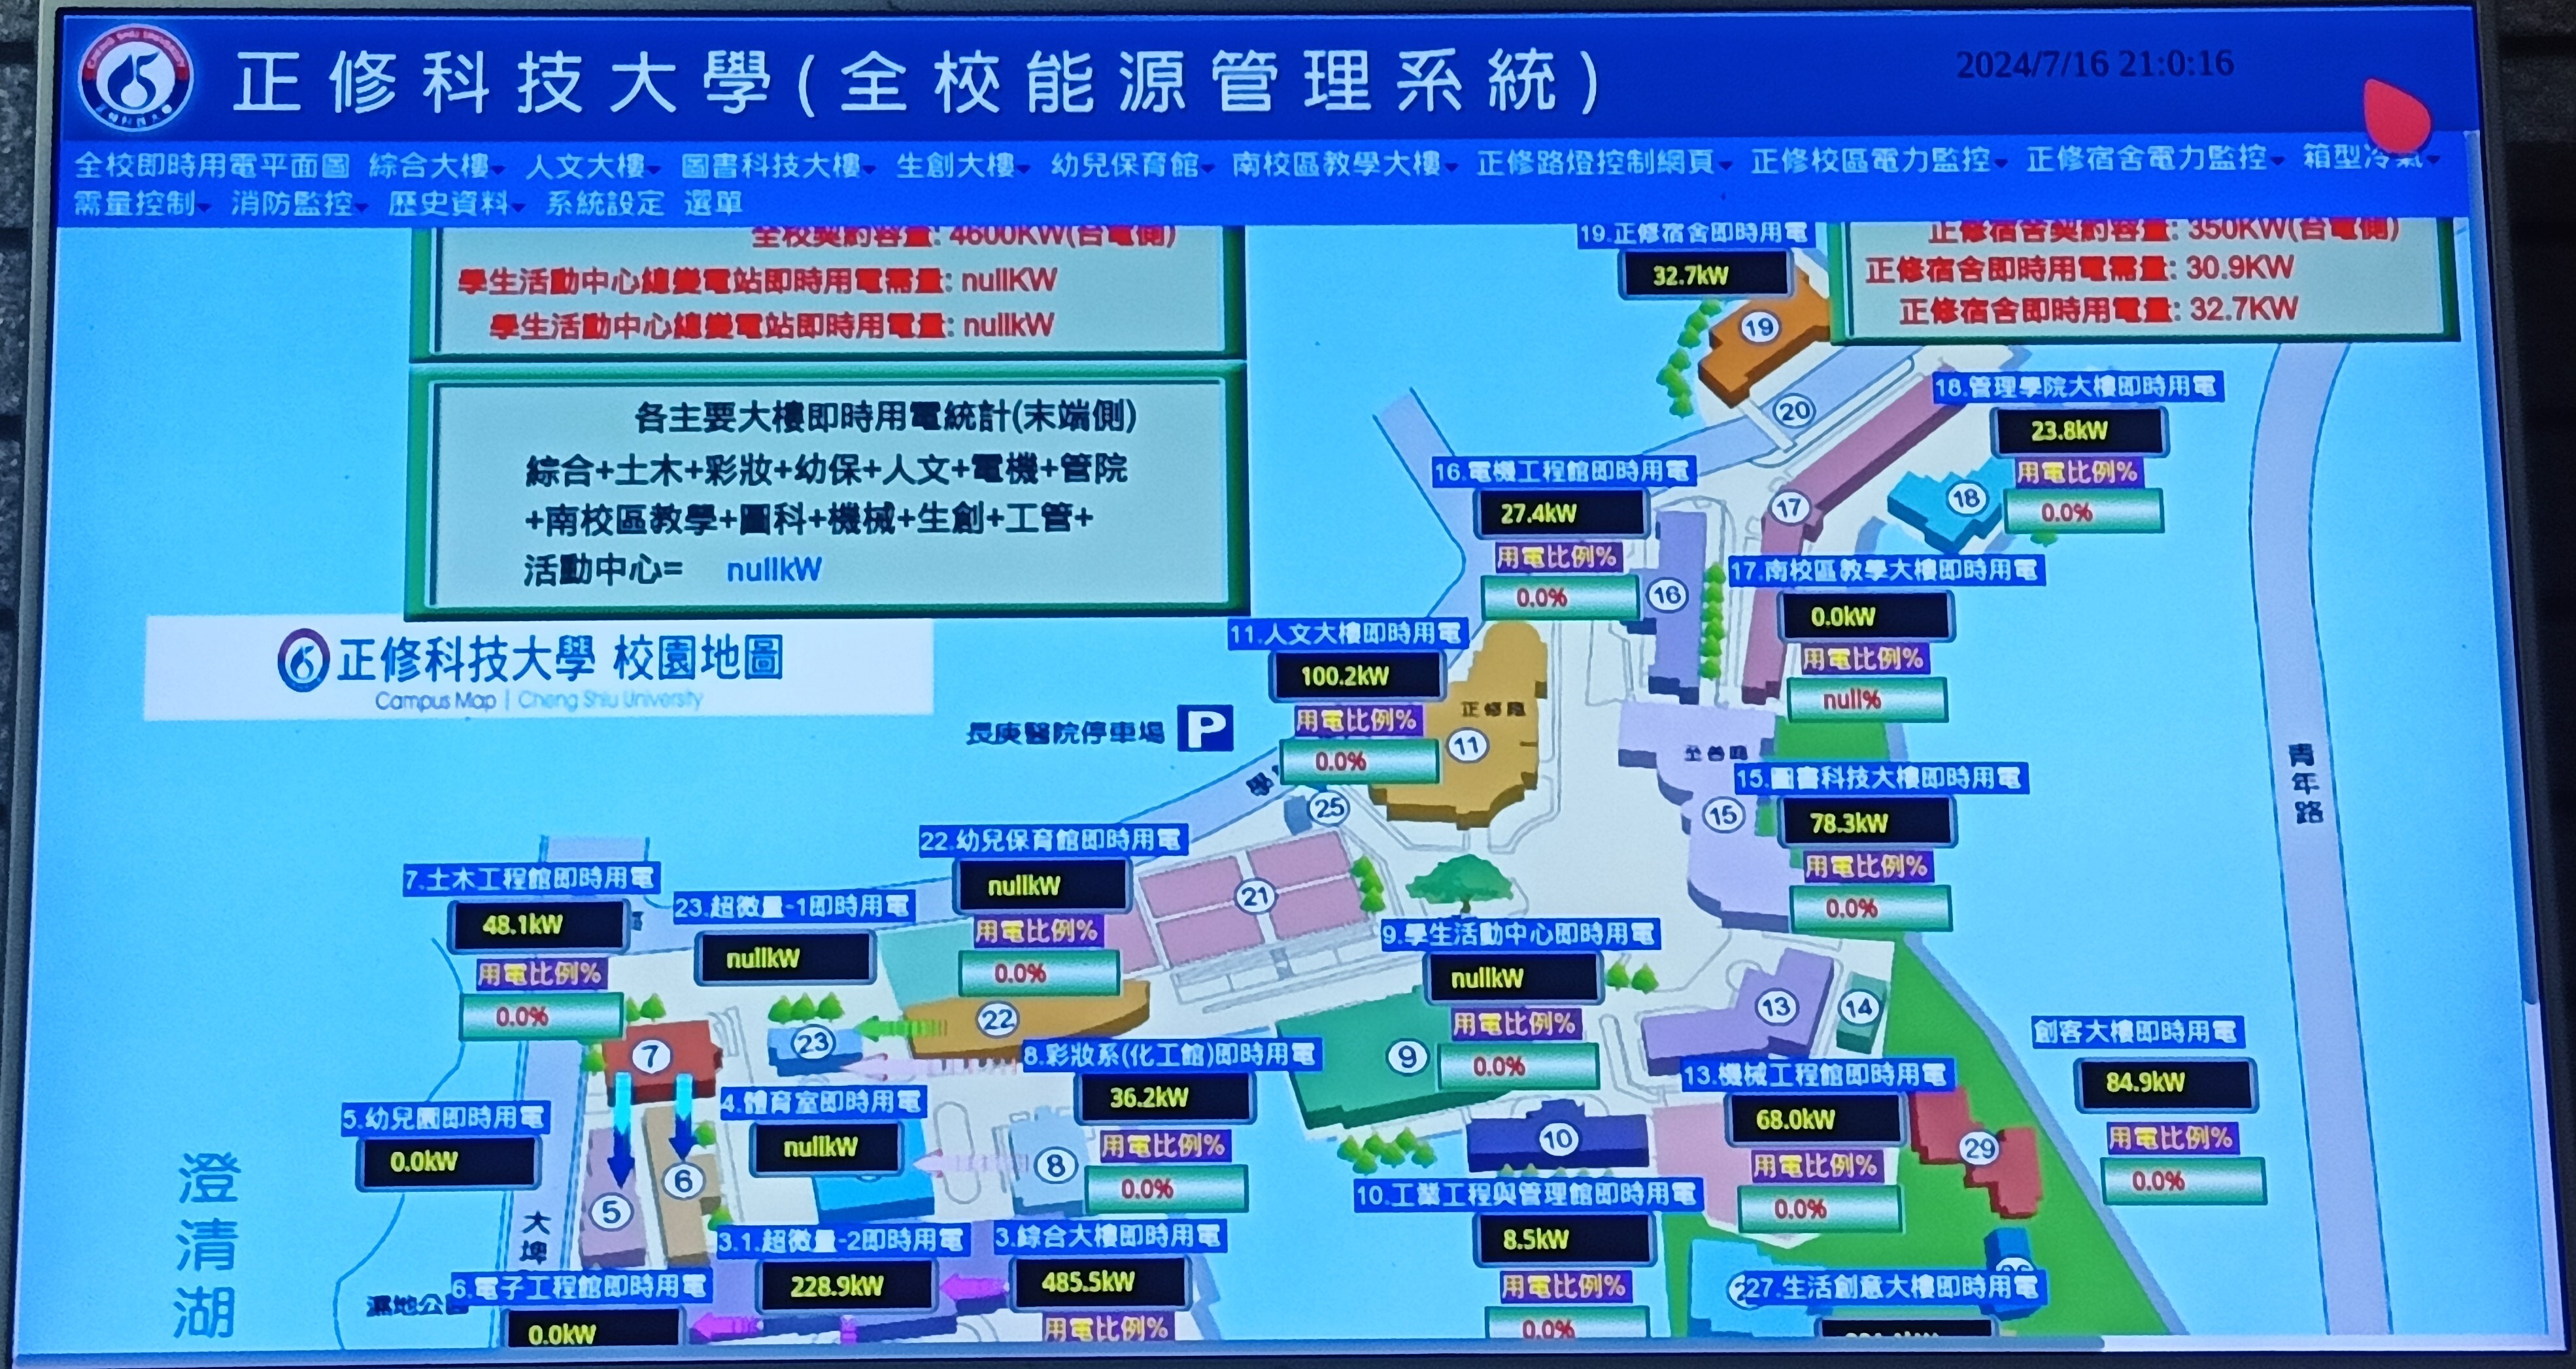
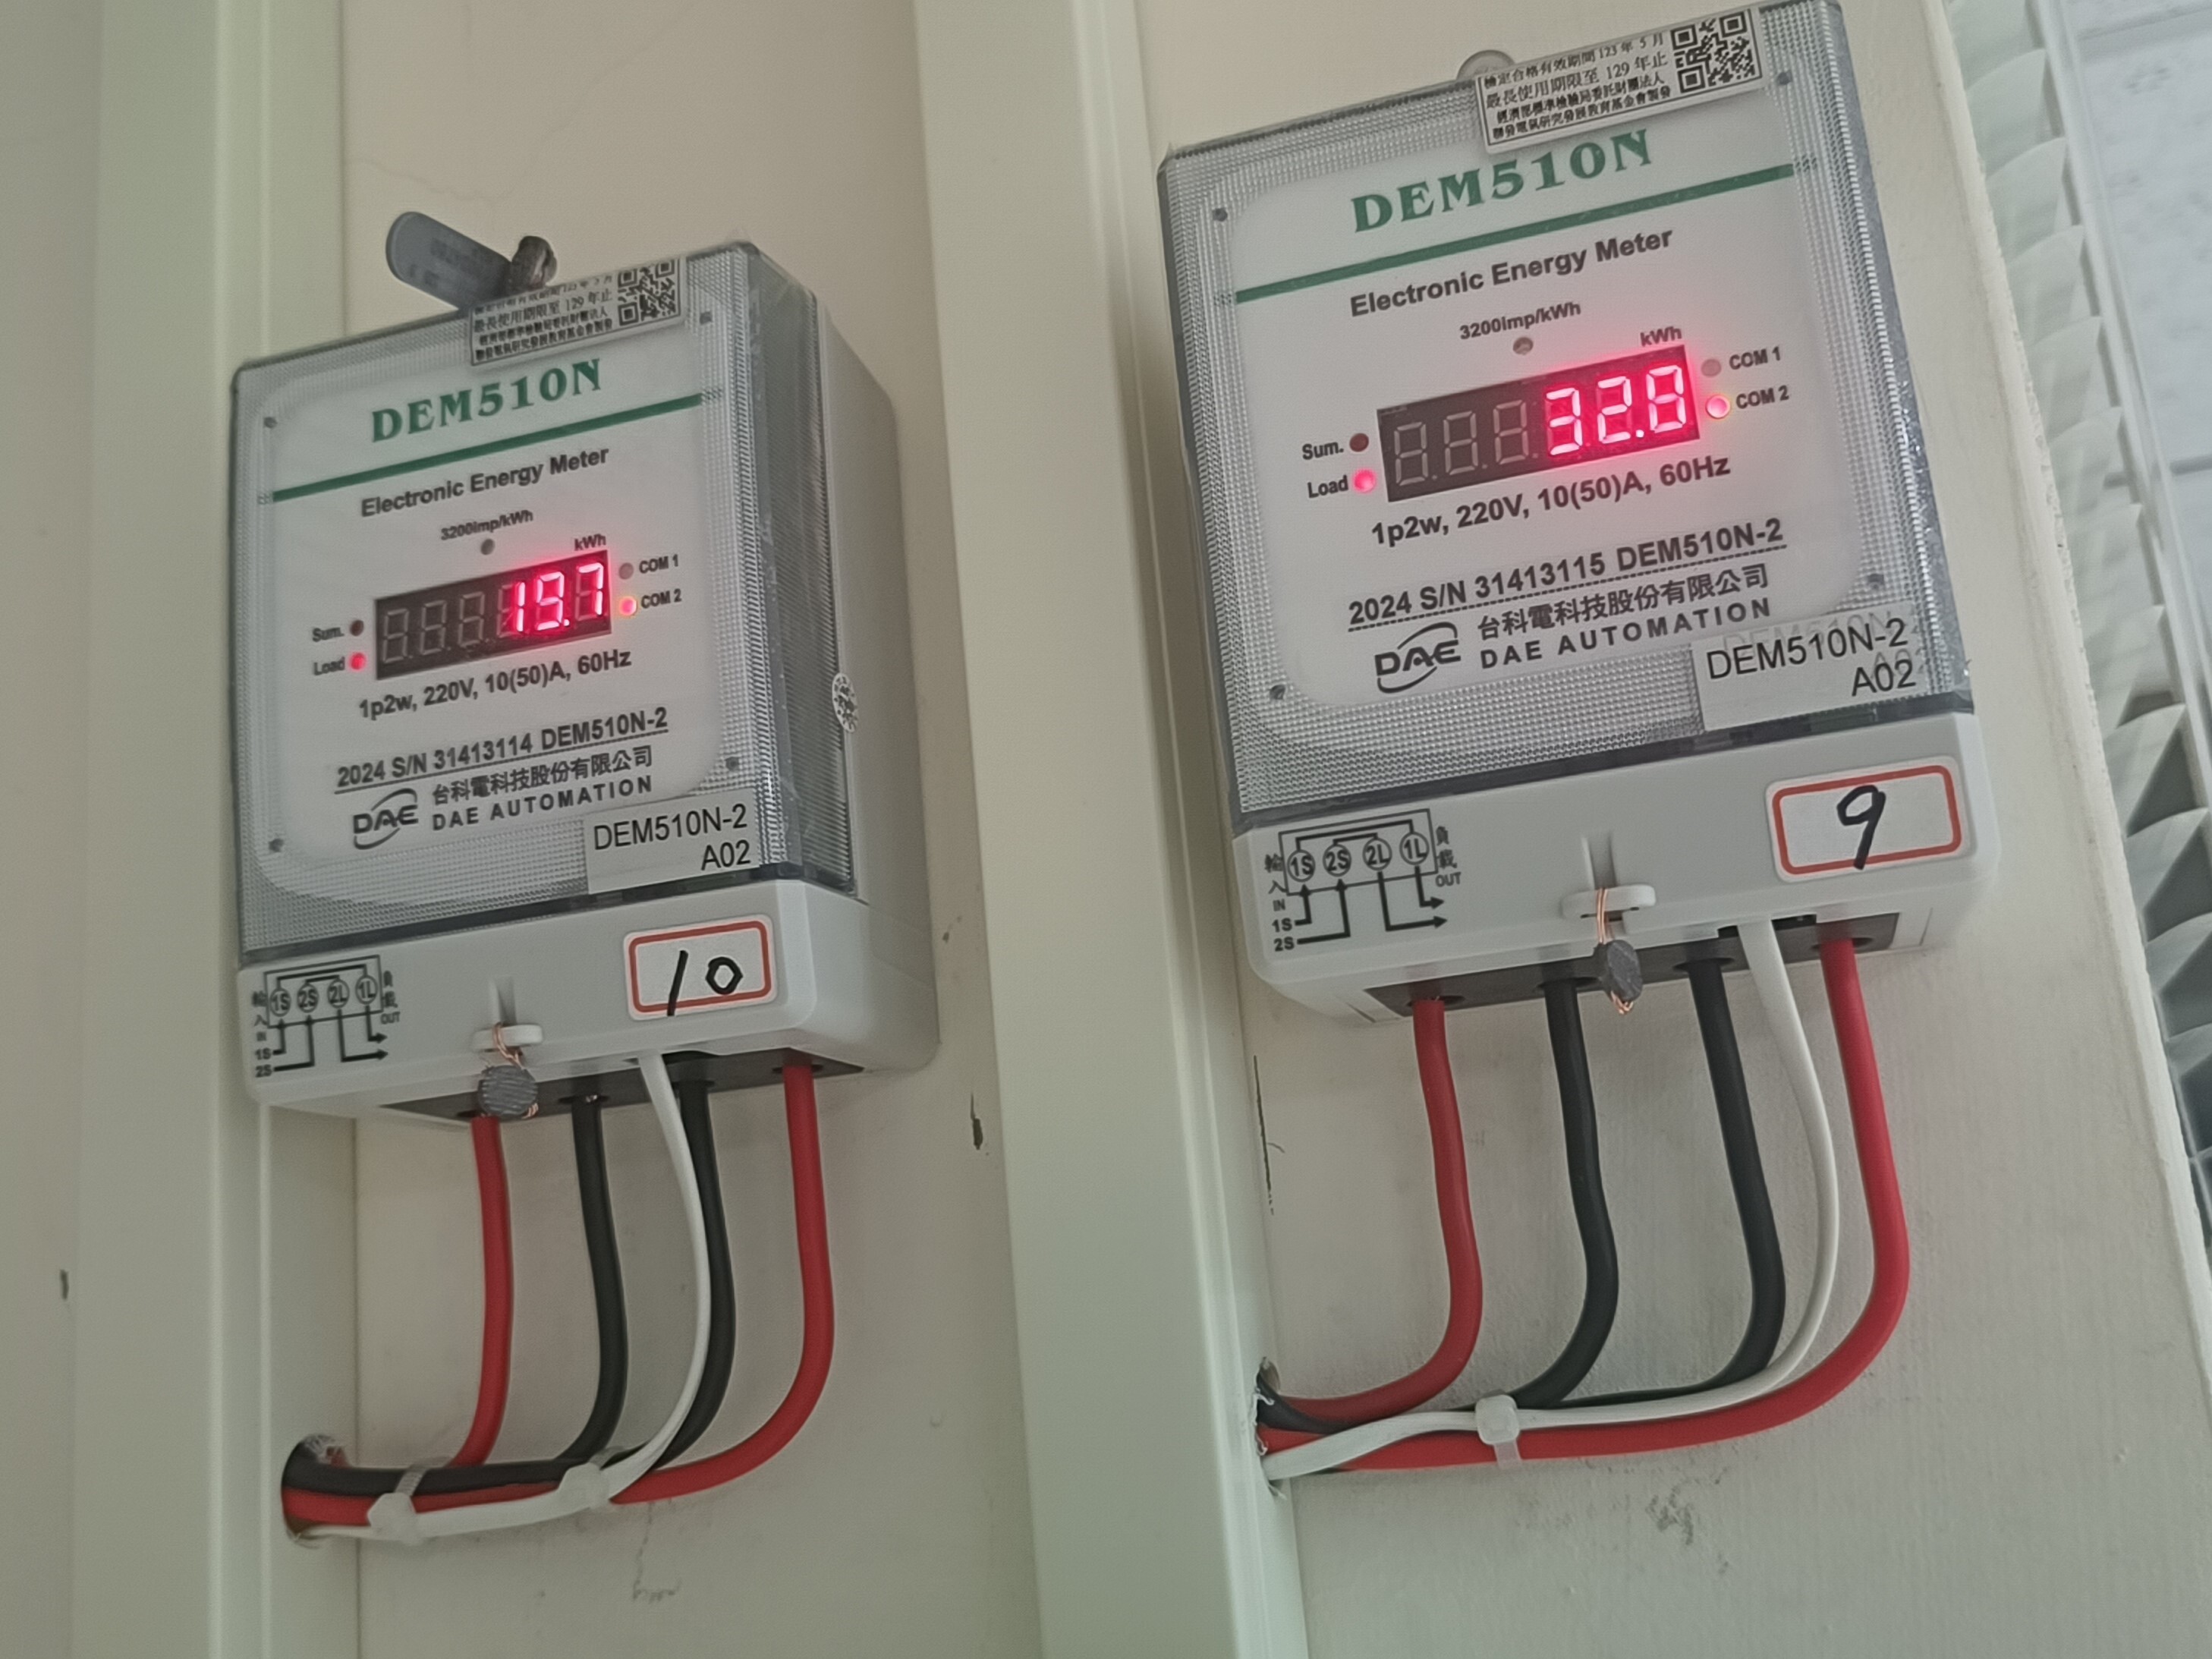
▲ Campus-Wide Energy Management System |
▲Smart Meters |
Greenhouse Gas Emissions Management
Since 2022, Cheng Shiu University has adopted the ISO 14064-1:2018 standard to establish a systematic GHG emissions management mechanism. Annual inventories and reports are conducted to monitor emission trends and enhance reduction performance.
Inventory results show that purchased electricity accounts for over 90% of total emissions, underscoring the University’s high reliance on external energy sources and providing critical reference for future carbon reduction strategies and energy transition planning.
In 2024, the University’s GHG inventory covered organizationally controlled emission sources (Scope 1 and Scope 2). Scope 1 direct emissions accounted for 6.05%, while Scope 2 indirect emissions made up 93.95%. Total CO₂ emissions in 2024 reached 7,357.42 tCO₂e, a reduction of 232.27 tCO₂e (3.06%) compared with the previous year.
GHG Emissions Overview
|
Item |
Unit |
2022 |
2023 |
2024 |
|
Category 1: Direct GHG Emissions |
tCO2e |
434.69 |
434.287 |
444.778 |
|
Category 2: Indirect GHG Emissions from Energy Inputs |
tCO2e |
7,101.19 |
7,155.404 |
6,912.6464 |
|
Total Emissions (Category 1 + Category 2) |
tCO2e |
7,535.88 |
7,589.691 |
7,357.4244 |
|
Gross Floor Area |
m2 |
212,732 |
215,168 |
215,168 |
|
GHG Emission Intensity |
tCO2e / m2 |
0.035 |
0.0353 |
0.0342 |
Note 1: Scope 1 GHG emission sources include: (1) Stationary combustion – mainly natural gas used in student cafeterias and emissions from building generators; (2) Mobile sources – primarily fuel consumption from vehicles; (3) Fugitive emissions – mainly refrigerants from air-conditioning units and related facilities.
Note 2: Emission factors are based on the EPA Greenhouse Gas Emission Factors Management Table, Version 6.0.4 (Taiwan, Environmental Protection Administration). Global Warming Potential (GWP) values adopt the 2021 IPCC published figures.
Note 3: The GHG inventory boundary is defined under the operational control approach. Emission intensity is calculated using the total emissions from Scope 1 and Scope 2.
Greenhouse Gas Reduction Pathway
Taking 2022 as the base year, the University targets an average annual carbon reduction of 4.2%. By 2036, cumulative reductions are expected to reach 40%, with emissions leveling off by 2045. Evaluations are conducted under two scenarios: BAU (Business as Usual) and SBT (Science-Based Targets), while actively implementing diverse carbon reduction measures.
(1) BAU (Business as Usual) Scenario: Without any GHG reduction measures, emissions are projected to rise in line with the national average annual electricity demand growth rate of approximately 2.8%. (Reference: Bureau of Energy, MOEA, “2023 National Electricity Supply and Demand Report,” which projects an average annual growth rate of 2.8% for 2024–2033.)
(2) SBT (Science-Based Target) Scenario: Following the Paris Agreement’s 1.5°C reduction pathway, the absolute contraction approach is applied, setting a target of reducing annual GHG emissions (Scope 1 + Scope 2) by 4.2% per year.
Net-Zero Carbon Reduction Roadmap
|
▲Greenhouse Gas Inventory and Voluntary Reduction Commitment |

Energy Consumption Characteristics and Challenges
At Cheng Shiu University, the average floor area per student is 13.9 m², significantly lower than the national university average of 24.3 m², reflecting higher space utilization efficiency and concentrated use of spatial resources.
The University has established campus-wide energy-saving management guidelines, analyzing electricity consumption patterns and the operation of energy-intensive equipment. Plans include introducing energy-efficient facilities, enhancing efficiency, and applying smart management systems to gradually reduce the impact of Scope 2 emissions on total carbon output.
|
Energy-Saving Challenges |
Challenge Description |
|
High Baseline Electricity Demand |
With A Large Building Area, High Campus Population, And Diverse Teaching Activities, The Baseline Electricity Demand Is Already High. Achieving Significant Energy Savings Requires Additional Investment, Such As Smart Control Systems, Air-Conditioning Replacement, And Space Reconfiguration. |
|
High Space Utilization Density |
Frequent Campus Activities And Round-The-Clock Space Usage (Including Day And Evening Programs) Result In Extended Electricity Consumption Hours And Complex Management. With An Average Floor Area Of About 13.9 M² Per Student, The Campus Falls Into A Medium-Density Category, Making Centralized Management Challenging And Limiting The Effectiveness Of Individual Behavioral Changes. |
|
Diverse Usage Behaviors Leading to Complex Management |
Teaching And Administrative Spaces Are Heavily Used, With Continuous Operation Of Air Conditioning And It Equipment. Electricity Demand In Offices And Laboratories Is Persistent. Certain Teaching Areas (E.G., Laboratories And Computer Classrooms) Operate Nearly All Day, Making Simple Rotation Or Shutdown Strategies Unfeasible. |
|
Tension Between Energy Saving and Teaching Quality |
As A University Of Technology, The Curriculum Places Strong Emphasis On Laboratory And Hands-On Instruction. Some Equipment Requires Long Operating Hours Or Specific Conditions Such As Constant Temperature, Humidity, Or Clean-Room Environments, Making It Difficult To Significantly Reduce Electricity Consumption. |
Corresponding Energy-Saving Strategies and Directions
|
Formulate University-wide Energy Conservation Guidelines |
|
Technology Adoption |
|
● Optimize the energy management system. |
|
Equipment Replacement |
| ● Replace outdated, energy-intensive air conditioners, lighting, and computer equipment with high-efficiency, eco-labeled products. |
|
User Behavior Management
|
|
● Promote energy-saving education for faculty and students, encouraging self-management and behavioral adjustments in energy use.
|
|
Zoning Strategy
|
|
● Classify and manage spaces with similar electricity usage patterns (e.g., high-consumption laboratories, low-frequency classrooms) to enhance zoning-based energy savings.
|
Renewable Energy Installation Sites
In response to global energy-saving and carbon-reduction trends, as well as local government regulations encouraging or mandating renewable energy adoption for high electricity users, the University has leased the rooftops of campus buildings to external enterprises for the installation of solar photovoltaic (PV) systems. These include the Library & Technology Building, College of Management Building, Student Activity Center, and five other facilities. In 2024, the total installed solar PV capacity reached 761.46 kW.
Renewable Energy Utilization Rate
Note: The proportion of renewable energy use = (Renewable energy consumption ÷ Total electricity consumption).
This includes both on-site self-consumption and the electricity sold back to Taipower.
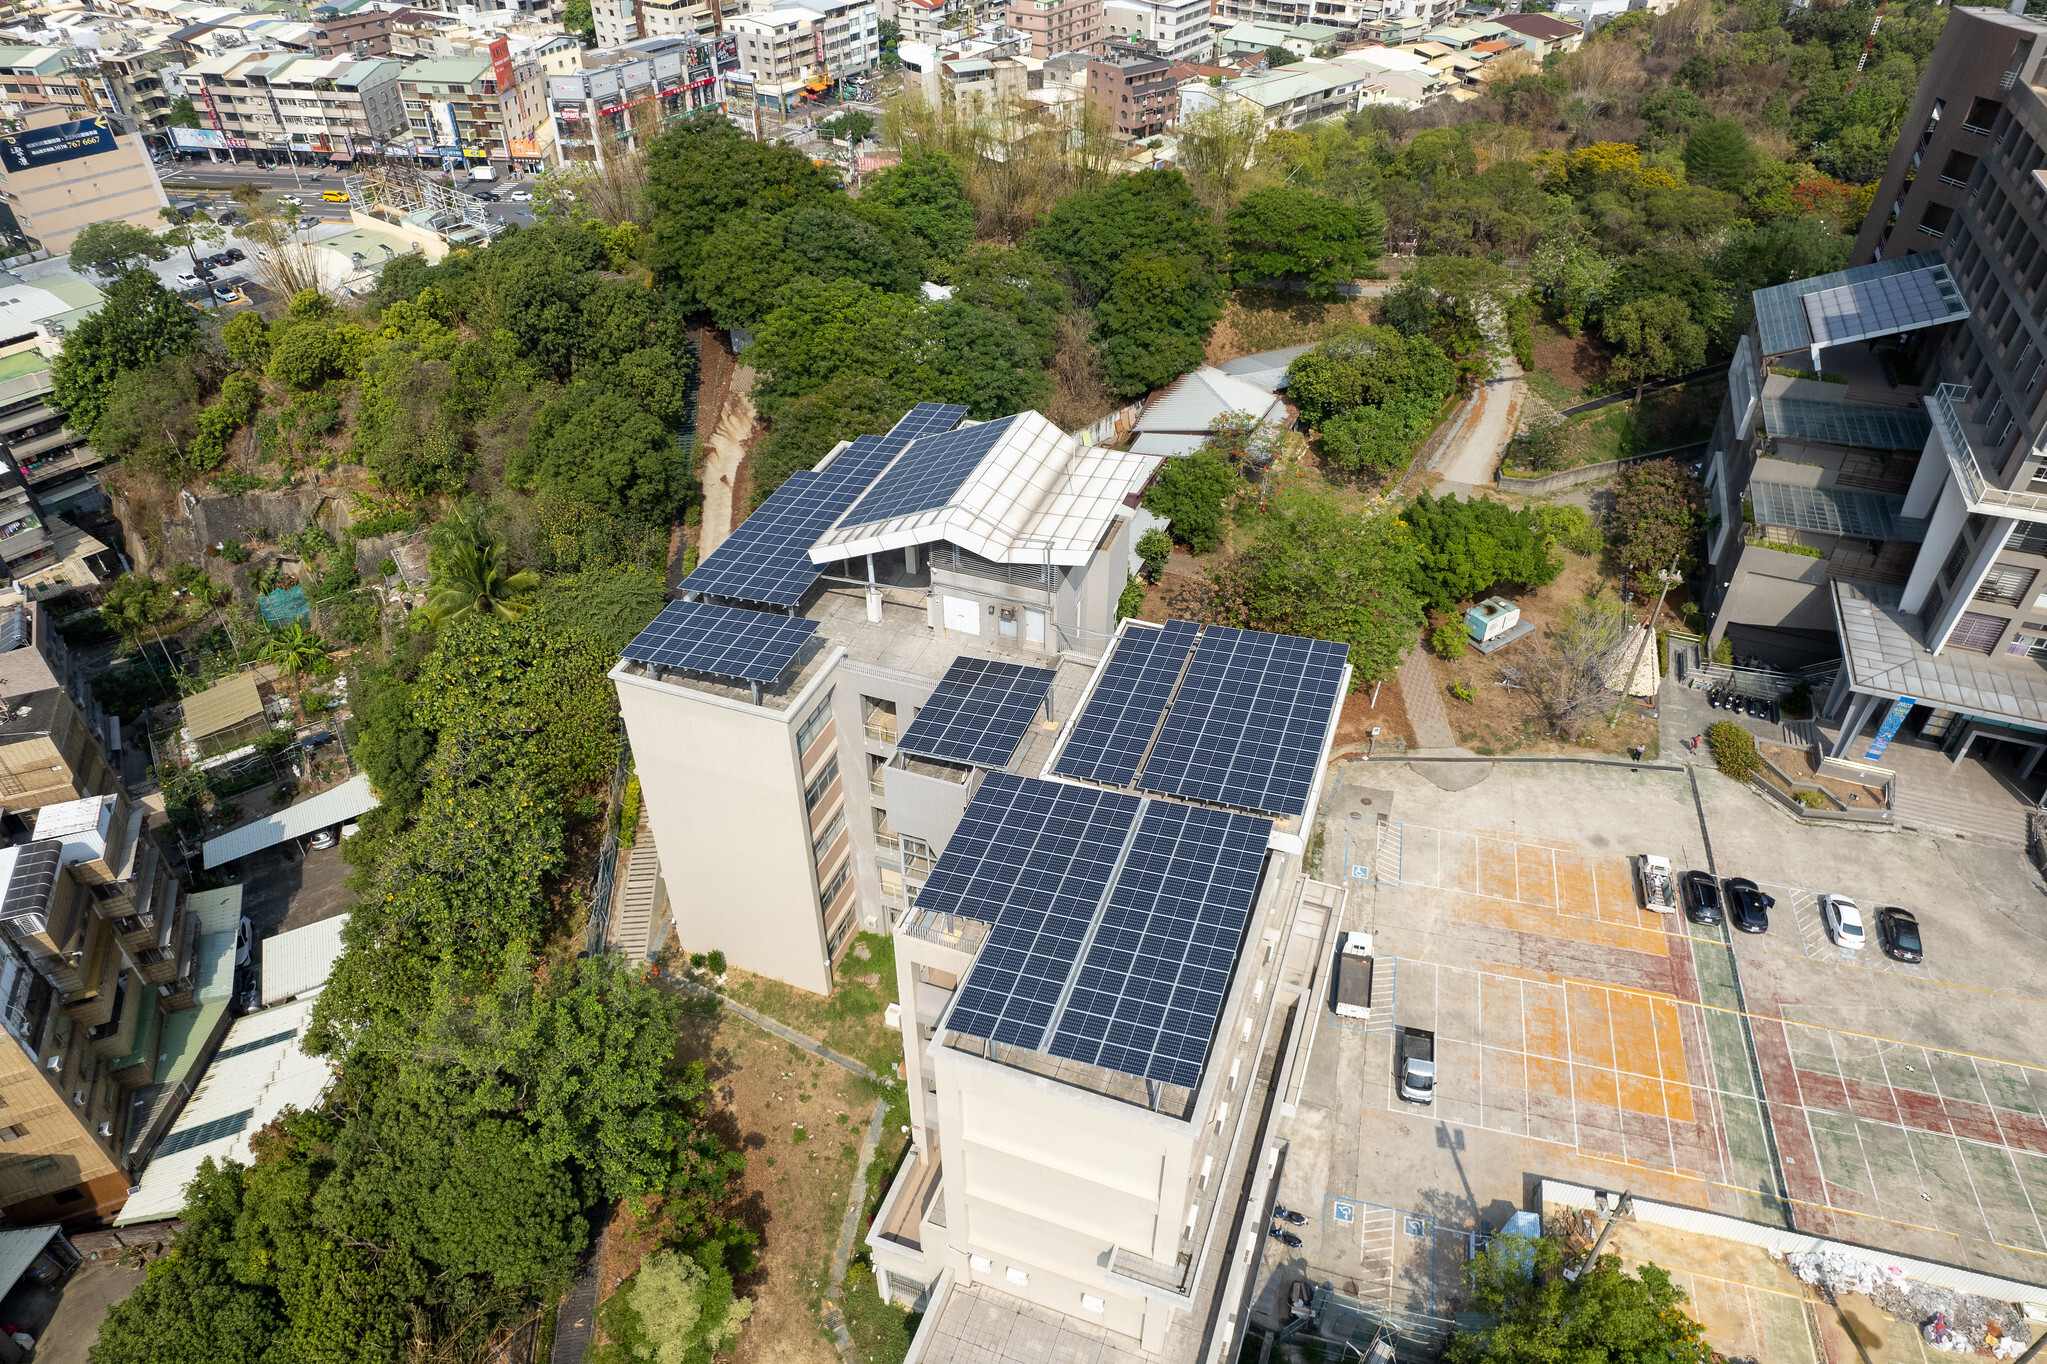
▲ Industrial park building, equipped with solar photovoltaic equipment
Water Resource Management
Campus water is mainly used for domestic needs, irrigation, and laboratories, with domestic use as the largest share. All sources are freshwater (≤1,000 mg/L TDS). According to WRI’s Aqueduct Water Risk Atlas, the University is located in a medium-to-low water risk area (yellow zone).
|
|
Since 2016, all wastewater has been connected to the municipal system and meets regulatory effluent standards. The University promotes water-saving through equipment upgrades, awareness campaigns, and integrating conservation measures in new construction.
In 2024, total water consumption was 145,658 tons, up 7.45% from 2020 due to new facilities such as the Kindergarten, Ultra-Precision Teaching Building, and International Student Dormitory. Despite this increase, per capita daily water use was only 24.33 L/day, far below the national technical university average of 70 L/day.
Water-Saving Strategies, Measures, and Performance
|
Water-Saving Strategy |
Specific Measures |
Expected / Actual Performance |
|
Outlet Flow Control Optimization |
Install water-saving valves and adjust faucet flow rates. |
Reduce daily water flow; each faucet saves ~20–30% of water consumption. |
|
Equipment Inspection and Maintenance |
Conduct regular leak inspections and repair immediately upon detection. |
Minimize leakage losses, improve system efficiency, and reduce unintended water waste. |
|
Priority Use of Water-Saving Devices |
Replace faulty equipment with certified water-saving devices. |
Long-term reduction in water consumption, in line with green procurement and carbon-reduction policies. |
|
Rainwater Harvesting and Reuse |
Install rainwater storage systems in new buildings to reuse rainwater and graywater for toilet flushing or irrigation. |
Reduce dependence on tap water, provide annual water-saving benefits, and serve as backup water supply. |
|
Comprehensive Building Water-Saving Planning |
Incorporate water-saving fixtures in both existing and new construction projects. |
Systematically lower water consumption, integrated into design phase while aligning with sustainability goals. |
|
Behavior-Oriented Water-Saving Culture |
Promote water-saving posters, slogans, and leak-reporting mechanisms to foster good habits. |
Increase water conservation awareness, enhance participation, and build a culture of collective action. |
Per Capita Water Use Intensity (L/Day) & Water-Saving Rate (%)
|
Year |
Total Water Consumption (m³/year) |
Faculty, Staff, and Students (persons) |
Per Capita Water Use Intensity (L/day/person) |
Water-Saving Rate (%) |
|
2023 |
135,560 |
16,948 |
21.91 |
-0.07% |
|
2024 |
145,658 |
16,402 |
24.33 |
-7.45% |
Notes 1: Water Use Intensity = (Total annual water consumption × 1,000 liters) ÷ 365 days ÷ total number of faculty, staff, and students.
Notes 2: Water-Saving Rate = (Previous year’s water consumption – Current year’s water consumption) ÷ Previous year’s water consumption.
Water Consumption & Per Capita Water Use Intensity
|
▲Installation of “Taiwan Good Water” drinking fountains at the tennis courts |
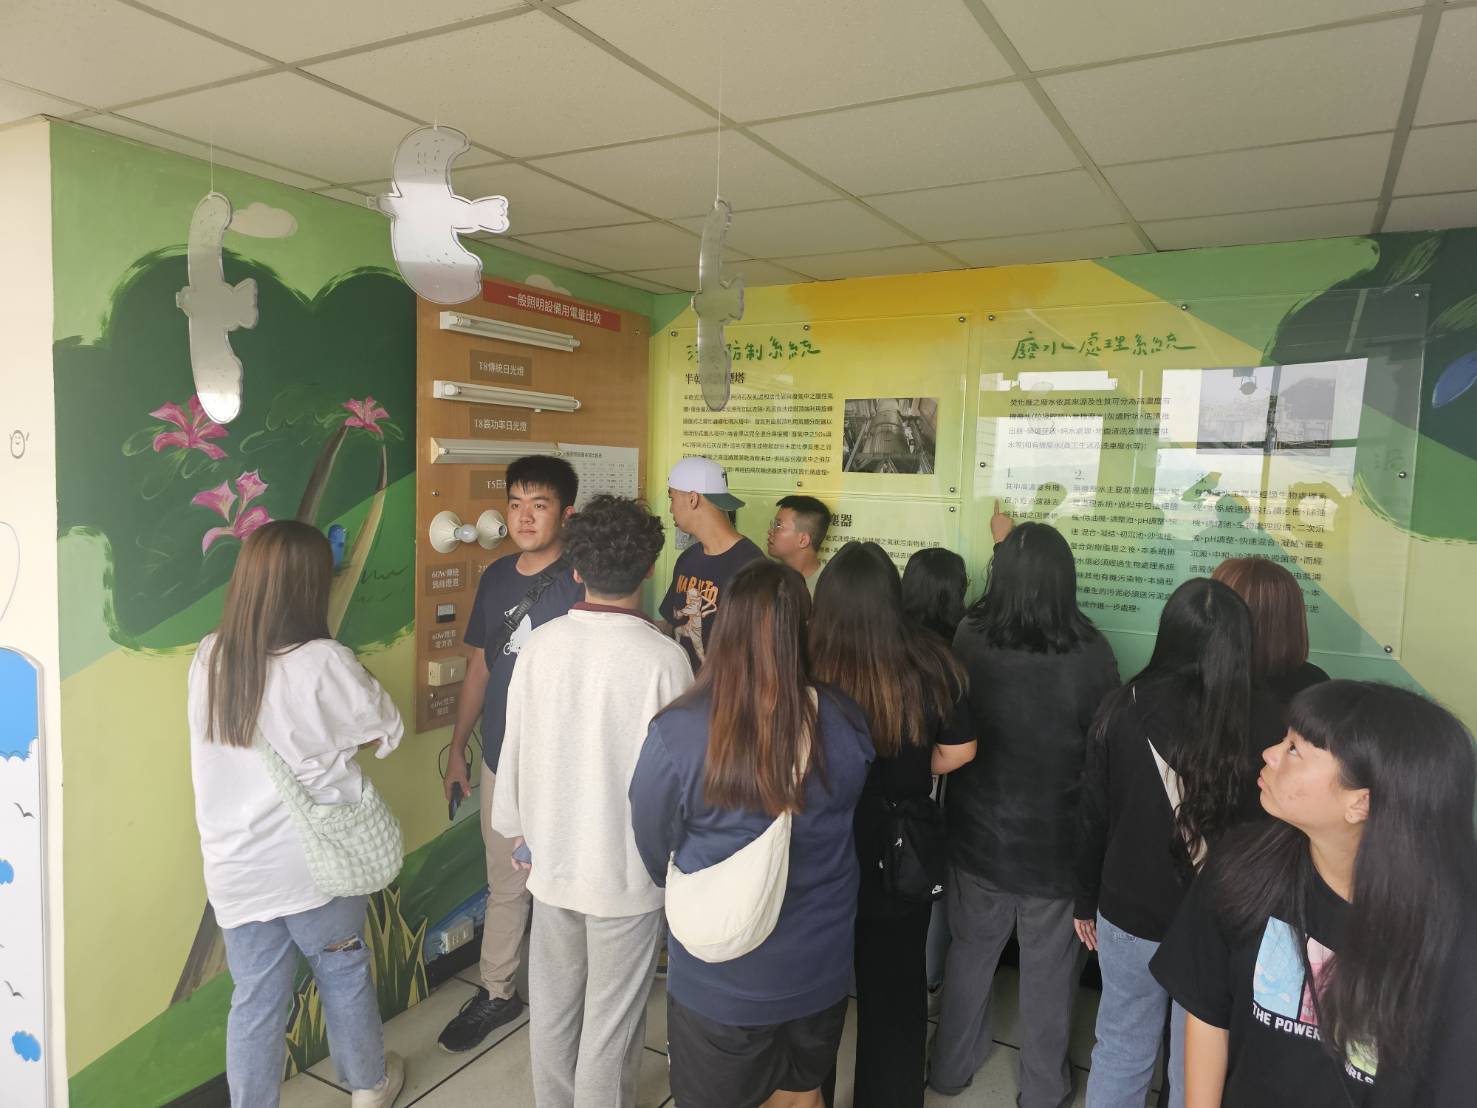
▲Visit to environmental education sites |