Climate Governance and Action
Climate Governance
The Social Responsibility and Sustainable Development Committee oversees climate strategies, risk management, and decision-making. Its climate risk, GHG inventory, and energy conservation teams conduct risk assessments, emissions reduction, and energy-saving initiatives to strengthen campus resilience and advance the net-zero transition.
GHG Inventory and Voluntary Reduction Declaration

Climate Risk and Opportunity Assessment
◎ Assessment of Climate-Related Risks and Opportunities
Following the TCFD framework, CSU assesses transition risks—policy and legal (R1), technology (R2), market (R3), and reputation (R4)—and physical risks—acute (R5) and chronic (R6). the results guide measures to reduce operational and financial impacts and enhance campus resilience.
Assessment horizons are defined as short term (1–3 years), medium term (3–10 years), and long term (over 10 years).
◎ Risk Matrix Assessment Method
Climate-related risks are evaluated using a quantitative scoring approach. Probability of Occurrence is categorized into five levels: 5 (Almost Certain), 4 (Likely), 3 (Possible), 2 (Unlikely), and 1 (Rare). Impact Level is divided into five levels: 5 (Severe), 4 (Major), 3 (Moderate), 2 (Minor), and 1 (Insignificant).
The risk level is calculated by multiplying probability by impact (Risk Level = Probability × Impact), serving as the basis for risk prioritization and resource allocation.
Existing risk control mechanisms are also reviewed to ensure effective mitigation and management capabilities.
◎ Scenario Simulation
COP30 (2025) warned that global warming is approaching—and may temporarily exceed—the 1.5°C threshold, making climate risks an immediate concern and calling for accelerated net-zero and adaptation action.
Under the TCFD framework, CSU applies Taiwan’s 2050 Net-Zero Pathway, the IPCC AR6 SSP5-8.5 scenario, and TCCIP data to assess physical risks from temperature and rainfall changes during 2021–2050, including impacts on energy, water, flooding, and slope hazards. Carbon fees and energy transition risks are also incorporated to guide climate strategy, risk management, and campus resilience.
|
Scenario Description |
Taiwan’s 2050 Net-Zero Pathway and Climate Change Response Act(Transition Risk) |
SSP3-7.0 High-Emissions Scenario |
|
Analysis Results |
The 2021–2050 analysis assumes carbon neutrality by 2045 and net-zero emissions by 2050. Based on Taiwan’s carbon fee regulations, it assesses carbon price changes and transition impacts. Carbon pricing and net-zero policies may increase carbon fees, energy costs, compliance requirements, equipment upgrades, and decarbonization investment, adding operational and transition pressures. |
TCCIP projections for 2045 indicate that Kaohsiung’s Niaosong District may experience a 0.9°C rise in annual mean temperature, 65 more warm days, 39 more extremely hot days, a 12.12% increase in annual rainfall, and a 181% increase in maximum daily rainfall. Intensifying heat and extreme rainfall may affect campus energy use, drainage capacity, and facility safety. |
|
Climate-Related Risks |
1. Net-zero pressure: CSU’s emissions are projected at approximately 3,000 tCO₂e annually by 2045, requiring continued reductions. 2. Rising carbon costs: Purchasing carbon credits at approximately NT$3,500/tCO₂e would add NT$10.5 million annually. Carbon fees may rise from NT$300 to NT$1,200–1,800 per tonne after 2030, increasing related costs four- to sixfold. 3. Regulatory exposure: Taiwan’s current 25,000-tonne threshold may be lowered to 10,000 or 5,000 tonnes, bringing CSU closer to regulation and increasing compliance pressure. |
1. Higher energy costs: Rising temperatures will increase cooling demand and maintenance costs. by 2050, air-conditioning electricity use may rise by 11.2%–12.8%, adding approximately NT$5.43–6.20 million annually. 2. Extreme rainfall: Heavier rainfall and flooding may threaten campus facilities and operational continuity. 3. Water stress: Greater drought and water-restriction risks may increase water and operating costs. |
| Climate Risk Response Strategies |
■ Energy Management and Decarbonization: Strengthen greenhouse gas inventories and energy monitoring through a campus Energy Management System (EMS); replace energy-intensive equipment, upgrade air-conditioning and lighting, expand solar power, and plan a smart grid. ■ Carbon Management: Improve emissions data and assess voluntary reduction and carbon credit mechanisms to mitigate carbon costs and enhance regulatory readiness. ■ Water Resilience: Introduce rainwater harvesting, water-saving equipment, and backup water sources to address drought and water restrictions. ■ Campus Adaptation: Upgrade drainage and flood-control facilities, while expanding green and permeable spaces to reduce flooding risks. ■ Sustainability Engagement: Secure energy-efficiency funding and promote green campus practices and low-carbon lifestyles among faculty, staff, and students.
|
|
Note: the 2045 projections are based on data from the Taiwan Climate Change Projection Information and Adaptation Knowledge Platform (TCCIP).
Climate Risk Management and Adaptation Strategies
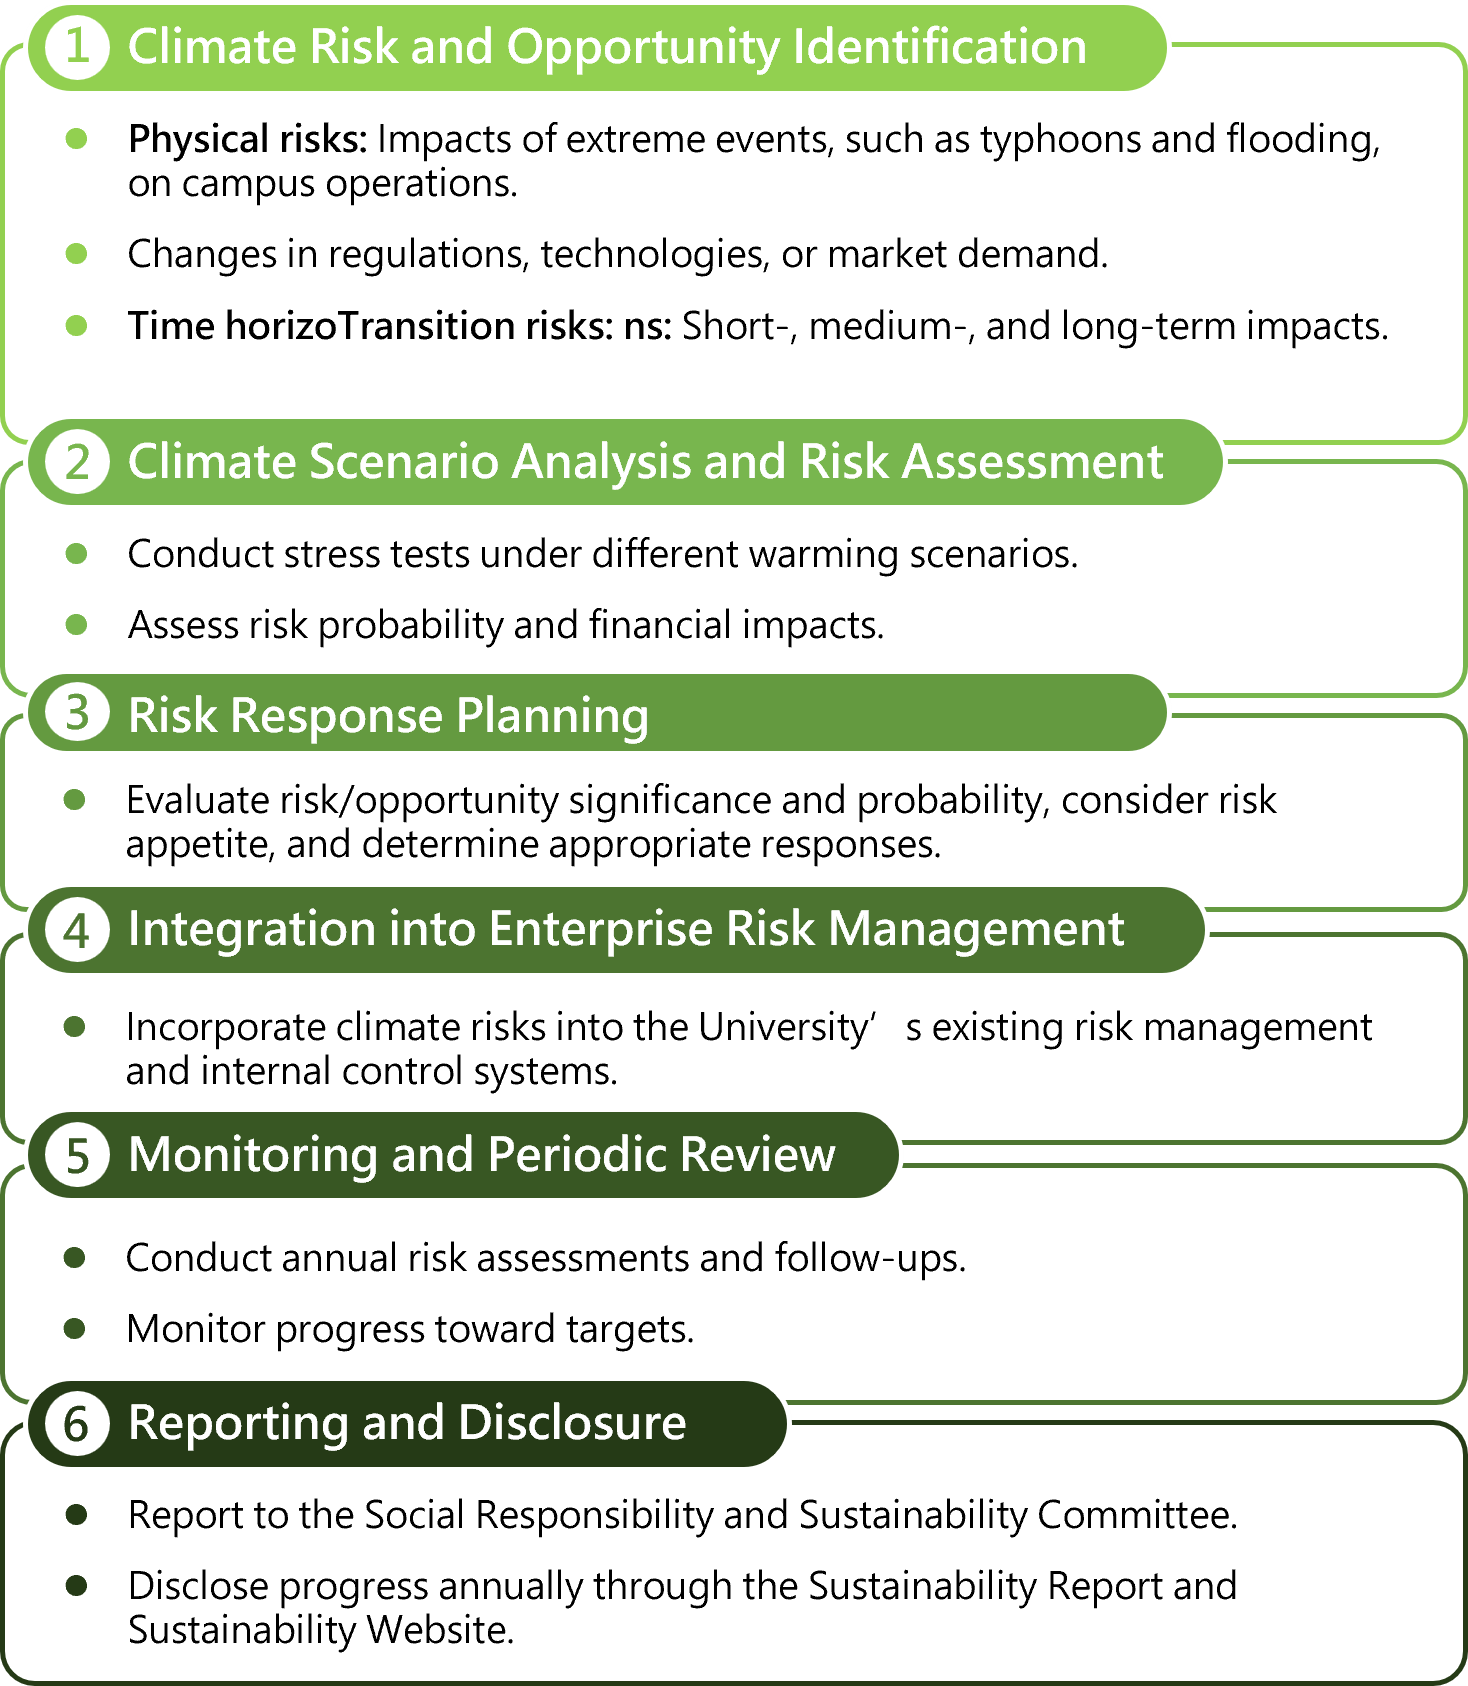
Under the TCFD framework, CSU systematically identifies transition and physical risks and assesses their operational and financial impacts to inform institutional decisions and resource allocation. Cross-unit measures covering energy transition, water management, and infrastructure adaptation strengthen campus resilience and safety. for details, see “2-2 Risk Management and Internal Controls.”
◎ Climate Risk Management Process
Greenhouse Gas Emissions Management
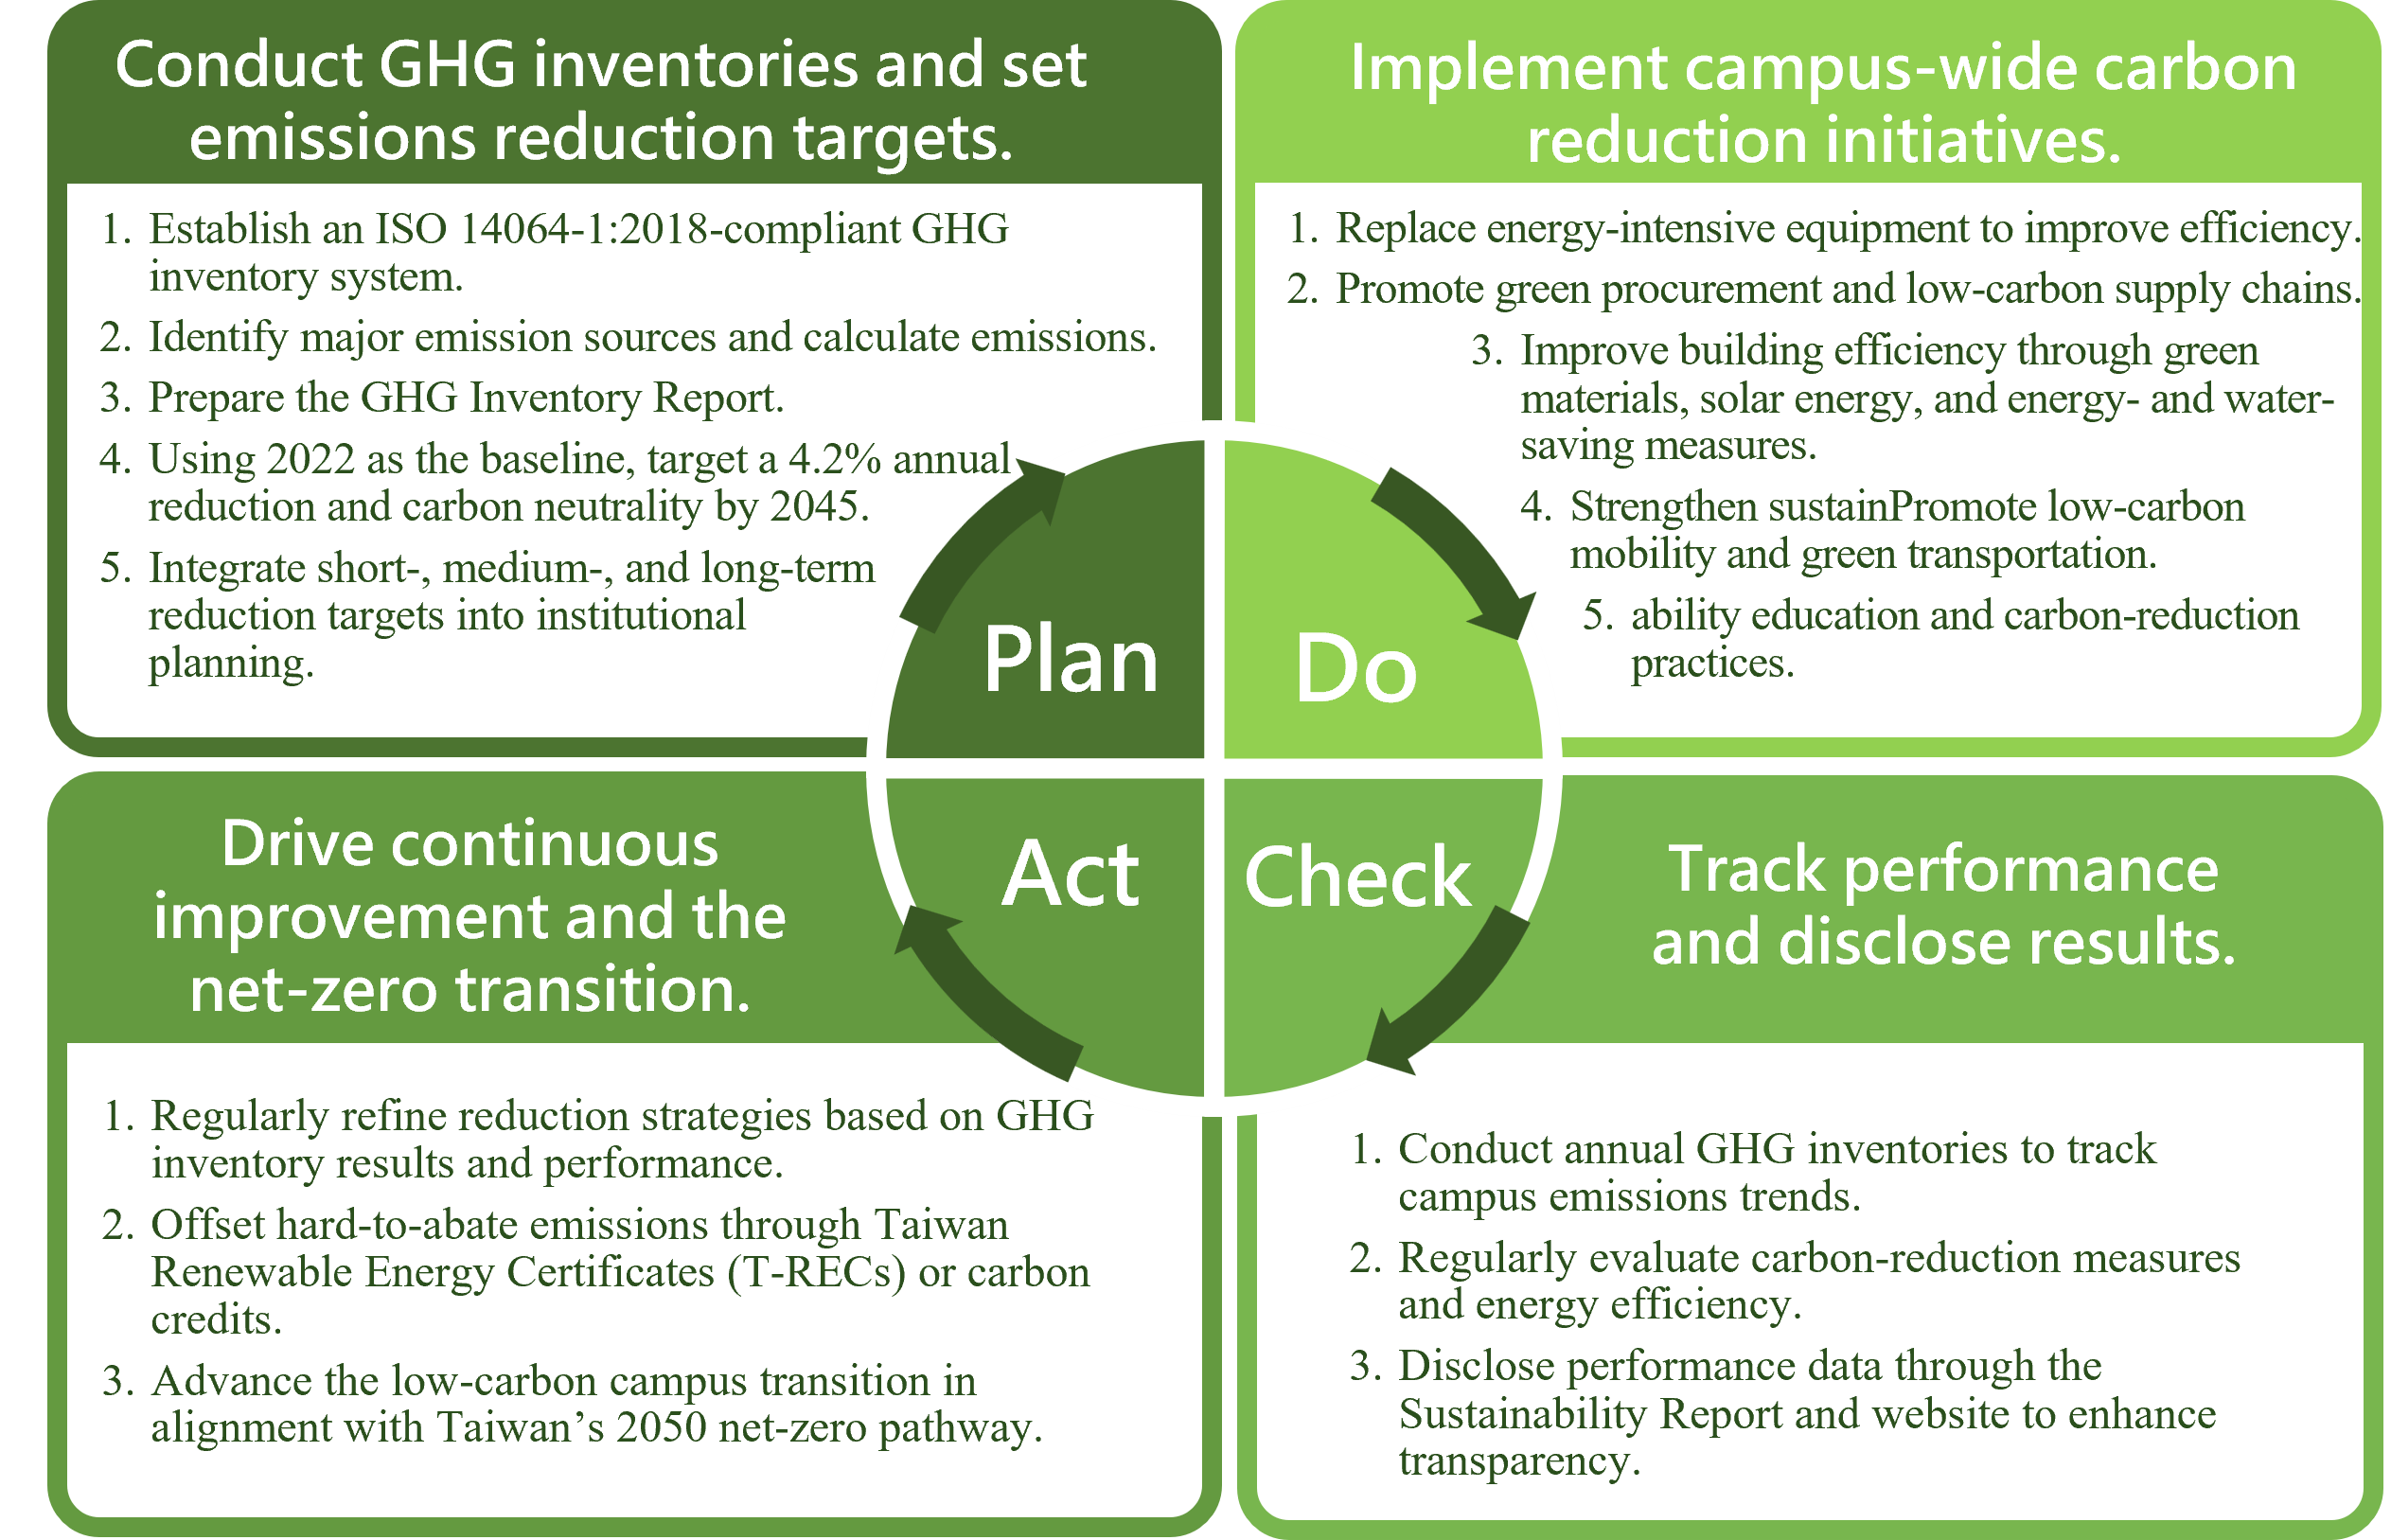
To advance sustainable campus governance, CSU adopted ISO 14064-1:2018 in 2022 and established a systematic carbon management framework. Regular GHG inventories and reports support emissions tracking and continuous reduction.
CSU published its first GHG Inventory Report in July 2023, with third-party assurance confirming the reliability of its procedures and data.
External verification is conducted every four years to strengthen governance and disclosure quality. the next verification is scheduled for 2027, reinforcing the credibility of CSU’s carbon data and commitment to environmental accountability.
◎ PDCA Cycle for Greenhouse Gas Management
◎ Carbon Reduction Targets and Progress
Using 2022 as the GHG inventory baseline year, CSU applies the SBT absolute contraction approach, targeting a 4.2% annual reduction in total GHG emissions.
CSU aims to reduce emissions by 24% by 2030 and 42% by 2036, progressing toward carbon neutrality by 2045. SBT and Business-as-Usual (BAU) scenarios are used to compare emissions pathways and guide energy conservation and transition strategies.
GHG Reduction Targets
|
Target |
Absolute Reduction Target |
Target Emissions |
|
Baseline Year |
First GHG inventory year; annual emissions reduction target of 4.2%. |
7,535.88 tCO₂e |
|
Short Term |
24% reduction from the baseline by 2030. |
5,687.47 tCO₂e |
|
Medium Term |
42% reduction from the baseline by 2036. |
4,396.55 tCO₂e |
|
Long Term |
60% reduction from the baseline by 2045. |
2,988.15 tCO₂e |
Note: (1) the SBT scenario follows the Paris Agreement’s 1.5°C pathway, applying the absolute contraction approach to reduce annual Scope 1 and Scope 2 emissions by 4.2%. (2) the BAU scenario assumes no reduction measures and applies the projected 2.8% average annual electricity demand growth for 2024–2033 from Taiwan’s National Electricity Supply and Demand Report.
◎ GHG Reduction Performance
In 2025, CSU conducted its GHG inventory in accordance with ISO 14064-1:2018 and Ministry of Environment guidelines, covering Category 1 direct emissions (Scope 1) and Category 2 energy indirect emissions (Scope 2). Scope 1 accounted for 7.08%, while Scope 2 accounted for 92.92%, confirming purchased electricity as the primary emissions source.
Total emissions were 6,841.5540 tCO₂e, down 515.8704 tCO₂e (7.01%) from 2024. Emissions intensity decreased from 0.0342 to 0.0318 tCO₂e/m², demonstrating the effectiveness of CSU’s energy-saving and carbon-reduction measures.
Direct and Energy Indirect GHG Emissions
|
Item |
Unit |
2023 |
2024 |
2025 |
|
Category 1: Direct GHG Emissions |
tCO₂e |
434.287 |
444.778 |
484.5349 |
|
Category 2: Energy Indirect GHG Emissions |
tCO₂e |
7,155.404 |
6,912.6464 |
6,357.0191 |
|
Total (Categories 1 and 2) |
tCO₂e |
7,589.691 |
7,357.4244 |
6,841.5540 |
|
Gross Floor Area |
m² |
215,168 |
215,168 |
215,168 |
|
GHG Emissions Intensity |
tCO₂e/m² |
0.0353 |
0.0342 |
0.0318 |
Note: (1) Category 1 sources include stationary combustion from cafeteria natural gas and backup generators, mobile combustion from vehicles, and fugitive refrigerant emissions from air-conditioning systems. (2) Emission factors follow Taiwan EPA’s GHG Emission Factor Management Table, Version 6.0.4, and GWP values follow the IPCC 2021 data. (3) the inventory boundary uses the operational control approach, while emissions intensity is calculated from total Category 1 and Category 2 emissions.
Greenhouse Gas Emissions (tCO2e)
Other Indirect GHG Emissions
To improve inventory completeness, CSU identifies and discloses other indirect emissions (Scope 3), including upstream transportation and distribution, operational waste, faculty, staff and student commuting, and business travel. These data support future carbon management and net-zero planning.
|
Category |
Description |
2025 Emissions |
|
Category 3: Indirect GHG Emissions from Transportation |
Upstream transportation and distribution, including the carbon footprints of electricity, diesel, and gasoline |
2,057.6301 |
|
Faculty, staff, and student commuting |
5,805.9245 |
|
|
Faculty and staff business travel |
101.9279 |
|
|
Category 4: Indirect GHG Emissions from Products Used by the Organization |
Purchased goods and services (municipal water) |
30.6050 |
|
Treatment and disposal of operational waste |
12.4001 |
|
|
Total |
8,008.4876 |
|
GHG Reduction Pathway
Using 2022 as the base year, the University targets an average annual GHG reduction of 4.2%, aiming for a 40% cumulative reduction by 2036 and stabilized emissions by 2045. Reduction pathways are assessed under BAU and SBT scenarios.
- Business as Usual (BAU): Without mitigation measures, emissions are projected to increase alongside Taiwan’s annual electricity demand growth of approximately 2.8% from 2024 to 2033, according to the Energy Administration’s 2023 National Electricity Supply and Demand Report.
- Science-Based Target (SBT): In line with the Paris Agreement’s 1.5°C pathway, the absolute contraction approach is applied to reduce annual Scope 1 and Scope 2 emissions by 4.2%.